Drivers of performance
 Article
Silvestro, R. “Do You Know What Really Drives Your Business’s Performance?” MIT Sloan Management Review (2016).
Reviewer
Dr. Allan Gray, Executive Director and Professor
Summary
Surprisingly few executives use data from their own organizations to test their assumptions about what factors drive financial performance. By gaining new insights into performance relationships within their own companies, managers can develop smarter strategies.
Silvestro explores the question by measuring the impact of variables in the “service profit chain.” The service profit chain suggests that employee satisfaction leads to higher service productivity, which leads to higher customer loyalty, which leads to improved profitability. Thus, investments in improvements in employee satisfaction and customer loyalty should have positive returns. Silvestro examines the correlation between the service profit chain variables for two retailers that have long adopted this management concept. The analysis reveals that, in both cases, the variables that the managers believed were driving their profitability were not always consistent with the service profit chain. The insights from examining their own data lead each company to think much differently about where they made their investments.
One of the retailers discovered that their assumptions about how employee satisfaction drove profitability was actually false. They found that employee satisfaction actually had a negative correlation with profitability. Upon further examination this big box chain retailer noticed that larger store formats tended to be more profitable than smaller store formats. Larger store formats, however, had substantially more SKUs, considerably more customer traffic, and a generally more stressful environment for employees leading to lower employee satisfaction. Employees recognized that larger stores were less pleasant places to work and questioned management’s commitment to the service profit chain model they had long espoused. This insight helped the managers realize that they needed to modify their overall rhetoric around the connection between employee satisfaction and financial performance. They changed to recognize the nature of the differences between work experiences at different types of stores.
What this means for food and agribusiness
How many of us would say we know the key drivers that determine the success of our companies, business units or teams? Most of us have a gut feel for these drivers, likely shaped by experience and concepts passed along to us through past managers and/or education. How close is our gut to reality? Probably not as close as we think. Most of us have access to more data than we can imagine. Shouldn’t we be using that data to test our gut feelings for the variables that drive performance the most?
In the agricultural input sector and particularly at the agricultural retail sector, we have an infatuation these days with big data, digitization, and precision agriculture. The industry believes it can gain tremendous benefit by examining a farmer’s data and finding insights to improve that farmer’s business. I have no doubts that there are benefits in this more analytical approach to production agriculture. But should we look in the mirror before we go too far down the path of fixing other people’s businesses?
What opportunities might we have to improve our own business performance through data analytics? Do we know which asset investments (human or physical) have the most impact on our profitability? Do we know which marketing programs we implement have the biggest impact on customer loyalty? Do we know which customers are truly the most profitable (maybe it is not the loyal customers)? Do we know which customers are buying products and services from all business units versus only some? Do we know which of our products and services are the most profitable for our customers? How effective are our sales training and leadership development programs in creating higher productivity? Which of our supplier relationships create the most long-term value?
The author of this research suggests that we can use a tool called topology mapping to help us better understand the drivers of performance. A topology map starts with identifying the key performance indicators (KPIs) in our business. Our assumptions drive this identification process about which key items drive performance. Most of us already have a version of these as part of our planning process. Correlation of KPIs should be measured over time to determine which ones are correlated positively or negatively to each other and to overall performance. Placing the KPIs on a “map” with arrows that connect the KPIs and identify the nature of the correlations can help us visualize the nature of our business model and how it may or may not align with our initial assumptions. An example of the topology map from the article is included in Figure 1.
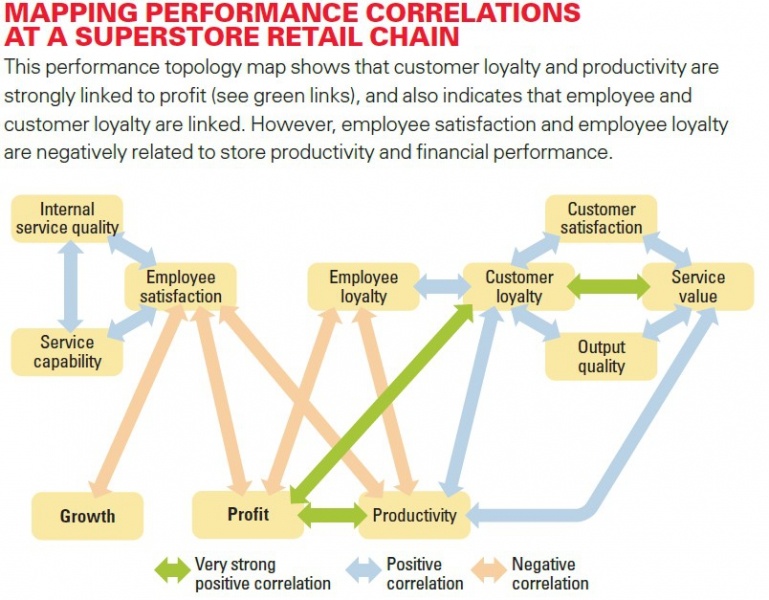
Figure 1. Example of the topology map for performance correlations.
Many of us can probably answer the questions above about our businesses. But are the answers driven by assumptions and hypotheses or are they driven by analysis of the data? Surely, if we believe data analytics is the key to improving the farm business, then data analytics should be the key to improving our own performance. The research in this study suggests that using data and analytics to critically evaluate our assumptions about what investments truly lead to higher performance in our businesses can have significant impacts. How much do you invest in the skill sets needed to take a more analytical look at ourselves in the mirror?
RELATED POSTS:
A great moment for value-based sales in agribusiness
Value-based sales can empower companies to craft compelling value propositions, understand the customer’s business model and effectively communicate to stakeholders.
How can big data empower the development of new products?
Data is one of the most powerful resources for a company. It enables accurate decision-making and minimizes risk, ensuring greater revenue and sustainable growth.
Unlocking Growth: Exploring innovation dynamics in the agrifood sector
The future for the agrifood sector appears promising, driven by technological advances, strategic M&A activity and a growing commitment to innovation.