
Author: Dr. Jeffrey S. Young, Assistant Professor, Agribusiness Economics, Murray State University
Recently, we looked at how the U.S. viewed various “big” establishments and constructs — specifically peoples’ confidence in the stability and sustainability of them — and took a peek at how this confidence varies by region. We saw a higher proportion of optimism in the West (AK, AZ, CA, CO, HI, ID, MT, NV, NM, OR, UT, WA, WY) and a higher share of pessimism in the South (AL, AR, DE, DC, FL, GA, KY, LA, MD, MS, NC, OK, SC, TN, TX, VA, WV).
This week, we’re going to cut the data a bit differently. Two big subjects under a great deal of scrutiny and skepticism are the federal government (nothing new there) and the U.S. economy. This is particularly true in light of the Omicron variant of the still-forever-seemingly-never-ending pandemic-era. The federal government is ever under the public eye, usually in a more disapproving light, and the economy has resumed to new heights suspiciously quickly, although recent corrections due to COVID have led to questions.
Previously, I looked at these two systems in aggregate, but this time, we’re really going to dig in: How does confidence in either of these differ by gender? Age? Education? All assessments were worded in the survey as, “On a scale from 1 (no confidence) to 7 (total confidence), score your view of the stability and sustainability of the following institutions…”. Then, respondents were presented with, in this case, the Federal Government and the U.S. Economy overall.
Let’s start with the first one of these survey factors, cutting the data by gender. Figures 1 and 2 show what we found.
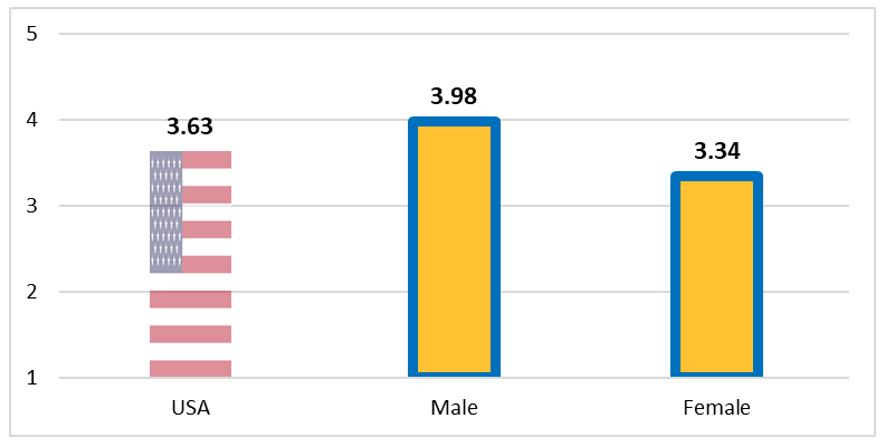
Figure 1. Confidence in the Federal Government, subset by gender.
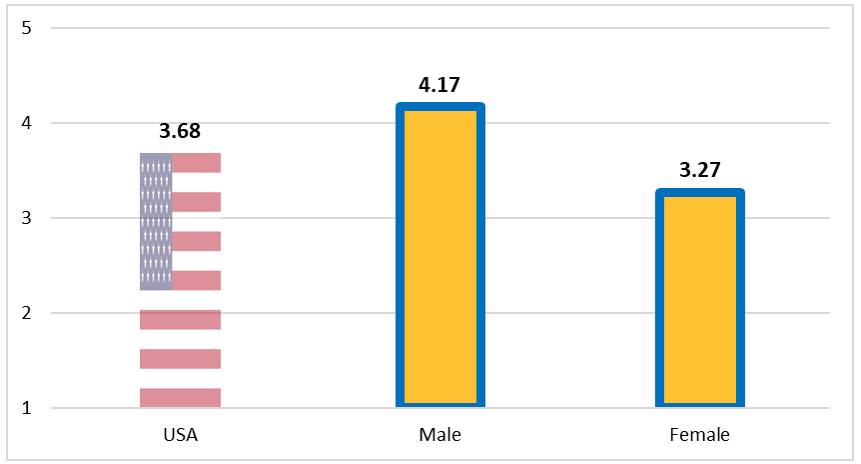
Figure 2. Confidence in the U.S. Economy, subset by gender.
In either case, though the two are intricately intertwined, male respondents tended to be notably more optimistic than female. Put differently, female respondents of our survey reported placing much less confidence than their counterparts in the stability and sustainability of the federal government. Ditto for the U.S. economy.
As for respondent age, there was a distinctive pattern that emerged for both establishments. Take a gander at Figures 3 and 4.
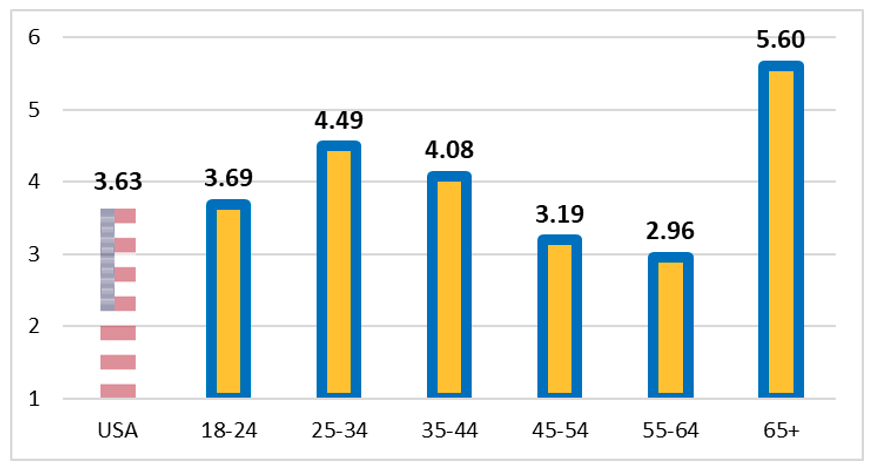
Figure 3. Confidence in the Federal Government, subset by age.
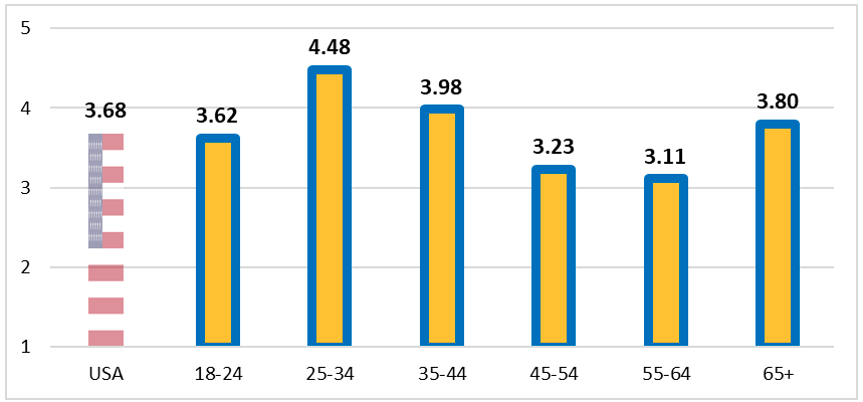
Figure 4. Confidence in the U.S. Economy, subset by age.
Did you see it? Here’s what jumps out to me … there is a surge of confidence in the younger age categories (the folly of youth, perhaps?) which tapers off dramatically into middle age (real life begins to set in). Then, it rises again in the highest age category. The main (and really only) difference I see is the highest age category has more confidence in the Federal Government than they do the U.S. Economy.
Last, we wanted to see what the confidence in these big two players looks like when we break it down by educational attainment. Does confidence increase with education? Decrease? Stay the same? Or do we have a weird, wavy pattern like in age? Figures 5 and 6 can help answer the question.
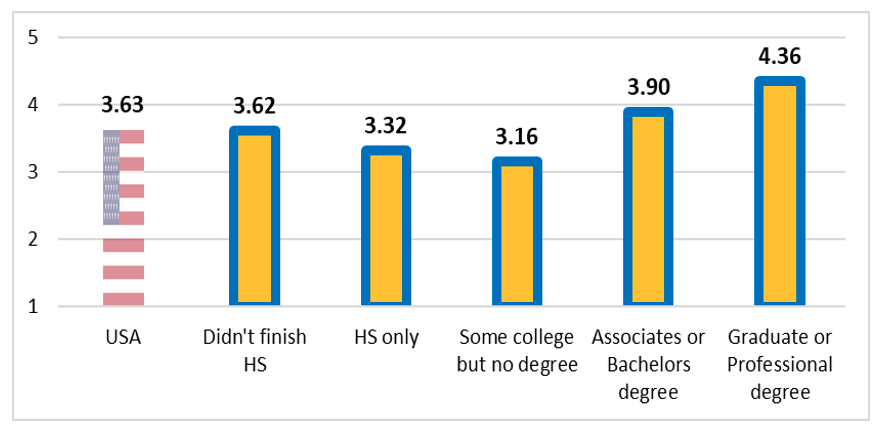
Figure 5. Confidence in the Federal Government, subset by education.
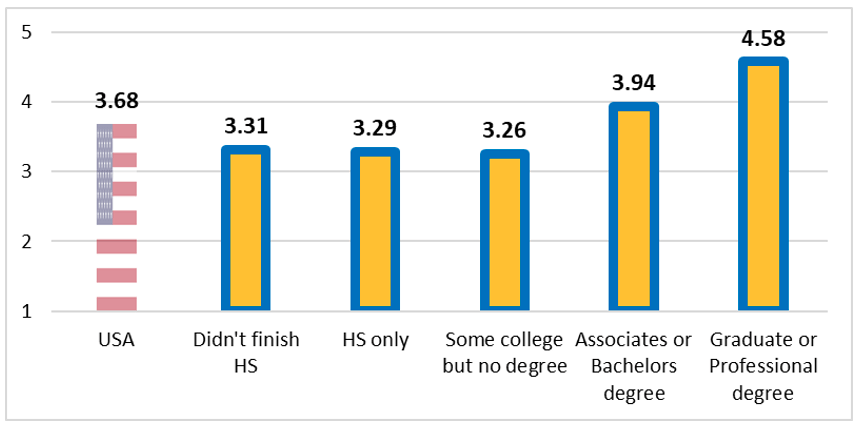
Figure 6. Confidence in the U.S. Economy, subset by education.
Again, we have a dip in the middle for both systems, but it happens earlier on in the education dimension than in age. However, one thing is clear: more education means, on average, more confidence.
We have plenty more on the way, rest assured … It’s rather interesting, and quite timely, given how our society is evolving so rapidly. Keep tuning in over the coming weeks as we keep digging and cross cutting the data for more fascinating takeaways!
ConsumerCorner.2022.Letter.4