


Few traditions spark both excitement and anxiety quite like back-to-school shopping. For students, it signals new opportunities; for parents, it’s a mix of nostalgia and logistical stress. As summer winds down, the signals of school’s return are everywhere: buses practicing routes, the heavy air of late August, and the smell of freshly waxed floors at “Meet the Teacher” nights. Somewhere in that mix, a supply list finds its way into parents’ hands, and the inevitable trip to the local big-box store begins.
Back-to-college season takes it up a notch. Beyond notebooks and calculators, it’s an entire dorm room or apartment that needs outfitting. Retailers now dedicate entire catalogs to dorm trends, making even the least style-savvy shopper an instant expert on what’s “in.”
Following the data trail
Consumer Corner is less interested in the shopping lists themselves and in what the data say about consumer decision making. Big data, which can be hard to interpret (or even identify), often exhibits signs of seasonality, or trends that vary by time of year. Over the years, we’ve tracked how online news and social media reflect trends, but recently, our team has added a new tool: location analytics and mobile data tracking through Placer.AI.
Placer AI’s platform is fairly straightforward. Many smartphone apps collect location data (with user consent – those “I agree” clicks you’ve probably made). These data, stripped of personally identifiable details, are aggregated and sold to firms that analyze movement patterns.
Placer.AI packages this data in a user-friendly way, while safeguarding individual privacy by excluding sensitive information like schools, private residences, and government buildings. The result is a large panel of anonymized visits that can be extrapolated to estimate population-level activity. You can find more about Placer.AI’s privacy policy here. Of course, not everybody in the U.S. allows location tracking (which can be disabled in your smartphone settings, including iPhone, as well as on other devices like smartwatches).
For this analysis, we didn’t look at schools themselves. Instead, we focused on one local and familiar destination: the Walmart in West Lafayette, Indiana. Using Placer.AI data from May 2018 through September 2025, we asked: can we detect a back-to-school shopping trend?
Annual and Monthly Patterns
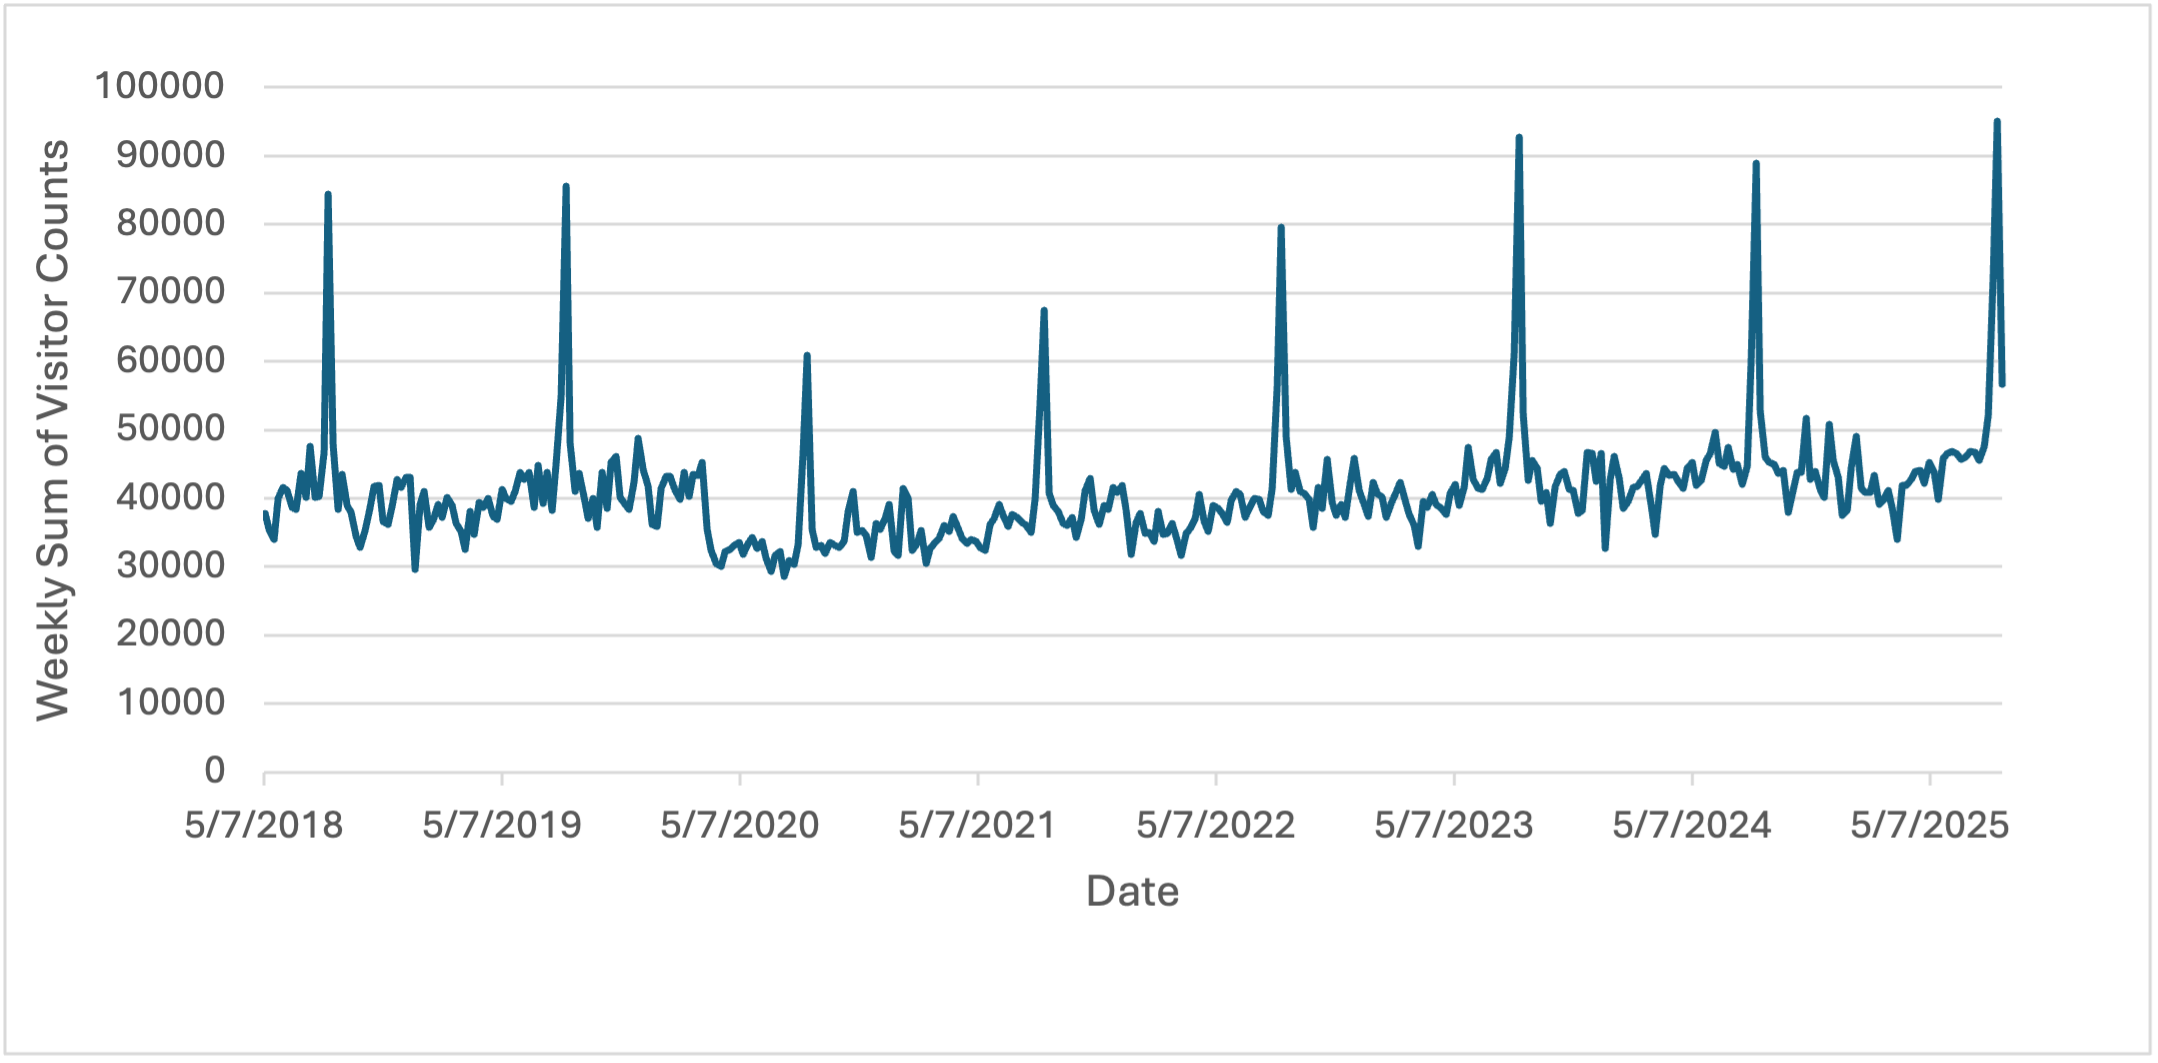
The first chart (daily visits) is hard to read, but a pattern quickly emerges: visitor spikes appear every August. Thanksgiving and Christmas Day are the only times visits drop to zero, reflecting Walmart’s holiday closures. To simplify, we will aggregate the data into weekly counts.
Average weekly visits by year show the expected pandemic dip in 2020-21, with traffic returning to pre-2020 levels by 2023 and continuing to grow through 2025.
|
Year |
Average of Visit Count at Walmart |
|
2018 |
40,916.0 |
|
2019 |
41,288.7 |
|
2020 |
35,940.3 |
|
2021 |
37,478.8 |
|
2022 |
39,724.0 |
|
2023 |
42,859.9 |
|
2024 |
44,653.2 |
|
2025 |
46,460.5 |
The previous table looked at trends between years. Monthly averages tell an even clearer story. August stands out with 55,395.9 average weekly visits to our local Walmart, 135% of the overall monthly average.
|
Month |
Average of Weekly Visit Count at Walmart |
|
January |
39,688.7 |
|
February |
38,913.3 |
|
March |
36,931.5 |
|
April |
38,380.6 |
|
May |
39,047.8 |
|
June |
40,634.9 |
|
July |
41,216.1 |
|
August |
55,395.9 |
|
September |
39,418.5 |
|
October |
40,403.9 |
|
November |
38,950.5 |
|
December |
40,219.6 |
|
Monthly Average |
40,935.9 |
Over eight years, the second or third week of August consistently records the highest traffic. In 2025, for example, the week of August 18 saw more than 95,000 visits – nearly double the store’s quietest weeks.
|
Week Start |
Week of the Month |
Visit Count |
|
8/6/2018 |
1 |
46,758 |
|
8/13/2018 |
2 |
84,501 |
|
8/20/2018 |
3 |
47,898 |
|
8/27/2018 |
4 |
38,415 |
|
8/5/2019 |
1 |
54,861 |
|
8/12/2019 |
2 |
85,655 |
|
8/19/2019 |
3 |
47,992 |
|
8/26/2019 |
4 |
40,998 |
|
8/3/2020 |
1 |
33,262 |
|
8/10/2020 |
2 |
46,807 |
|
8/17/2020 |
3 |
60,948 |
|
8/24/2020 |
4 |
35,453 |
|
8/31/2020 |
5 |
32,838 |
|
8/2/2021 |
1 |
39,948 |
|
8/9/2021 |
2 |
54,239 |
|
8/16/2021 |
3 |
67,419 |
|
8/23/2021 |
4 |
40,770 |
|
8/30/2021 |
5 |
38,962 |
|
8/1/2022 |
1 |
41,396 |
|
8/8/2022 |
2 |
56,387 |
|
8/15/2022 |
3 |
79,631 |
|
8/22/2022 |
4 |
48,909 |
|
8/29/2022 |
5 |
41,343 |
|
8/7/2023 |
1 |
61,157 |
|
8/14/2023 |
2 |
92,717 |
|
8/21/2023 |
3 |
52,316 |
|
8/28/2023 |
4 |
42,596 |
|
8/5/2024 |
1 |
60,403 |
|
8/12/2024 |
2 |
88,946 |
|
8/19/2024 |
3 |
52,712 |
|
8/26/2024 |
4 |
45,988 |
|
8/4/2025 |
1 |
52,173 |
|
8/11/2025 |
2 |
72,679 |
|
8/18/2025 |
3 |
95,146 |
|
8/25/2025 |
4 |
56,633 |
While we can’t claim causality from simple visit counts alone, the timing aligns neatly with the back-to-school and campus rush. Now, that isn’t to say that back to school is the driver, but the timing is too consistent to ignore.
Weekday insights
Now, let’s see how weekday visits vary.
|
Day of the Week |
Average of Visit Count |
|
Sunday |
6,716.1 |
|
Monday |
5,329.5 |
|
Tuesday |
5,003.4 |
|
Wednesday |
4,978.1 |
|
Thursday |
5,147.6 |
|
Friday |
6,386.3 |
|
Saturday |
7,393.3 |
|
Daily Average |
5,850.5 |
The data also reveal informative shopping habits:
- Busiest days: Saturday (7,393), Sunday (6,716) and Friday (6,386). Together, they account for an average of 20.5 thousand visitors to our local Walmart, which is more than half of the visitors the store sees on a weekly average.
- Quietest day: Wednesday (4,978), with just 12% of weekly traffic.
So if you’re local and want to avoid the crowds, Wednesday might be your best bet – at least until everyone else catches on.