Author: Jian Yu, PhD Student, Department of Agricultural Economics, Purdue University
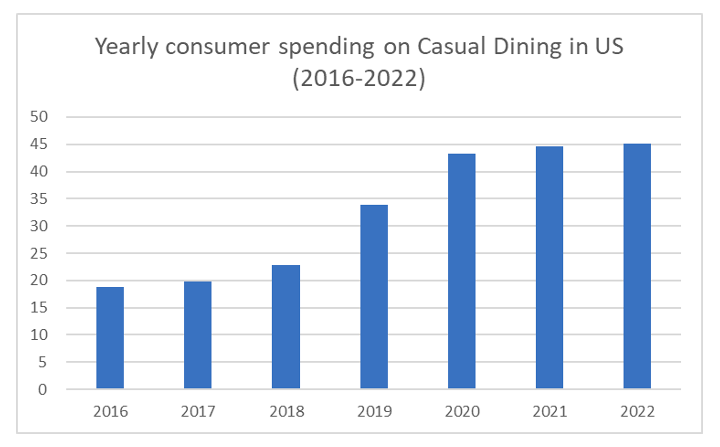
Spending on casual dining restaurants has been increasing during recent years. In the samples from our CFDAS Database, the aggregate netspends on casual dining in billions $ from 2016-2022 were 18.9, 19.9, 22.7, 33.9, 43.3, 44.7, and 45.2. Those values represent increases annually from 2017 to 2022 of 5%, 14%, 49%, 28%, 3%, and 1%.
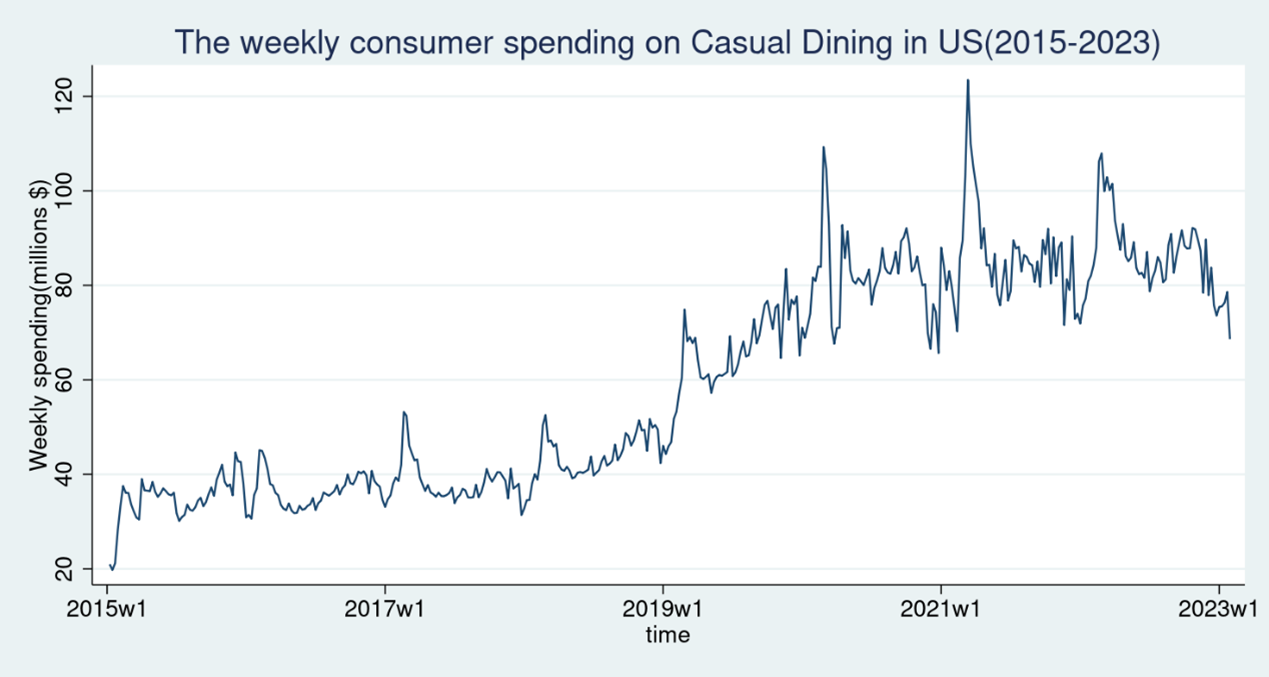
Even during the years impacted by the Covid-19 pandemic, people still exhibited some willingness to dine out. Although there was a decline after March and April 2020, it recovered, going up to another peak in February 2021. When looking at the information from the weekly trend of spending, we can see the spending peaks in February, and the decline in March and April looks more like a seasonal phenomenon.
Why do people have a high willingness (that keeps increasing) to dine out in the U.S.? A study by Eddie Yoon (2017) in the Harvard Business Review found that 50% of people in the U.S said they hate to cook, only 15% of people said they love to cook, the rest (35%) said they neither love nor hate cook. Thus, most people do not like to cook, hence they have a high willingness to eat out. While people spend time and money to eat out, they also spend time and money shopping for food and cooking. With recent inflationary pressures and rising prices, comparatively, casual dining restaurants may be more affordable compared to the cost of cooking than in the past.
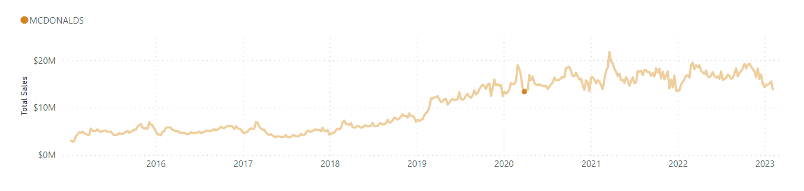
Fast Food has advantages in this pandemic-era. Although it may not be healthy, this could be a good deal financially compared to cooking. Fast food brands like McDonalds, Dunkin Donuts, and Taco Bell performed well during the pandemic-era.
Online ordering systems may contribute to the increasing sales of fast food. Conveniently, people can use apps to order their food and choose pick up or delivery. In contrast, sometimes people have to wait in line at restaurants during busy lunch periods. The delivery option is a potential further advantage of fast food restaurants relative to sit-down establishments. From our Database, the spending on food delivery apps (e.g. Uber eats and Doordash) increased at an upward rate since 2019. Even though the food delivery option involves service fees, it still has many convenience and accessibility advantages.

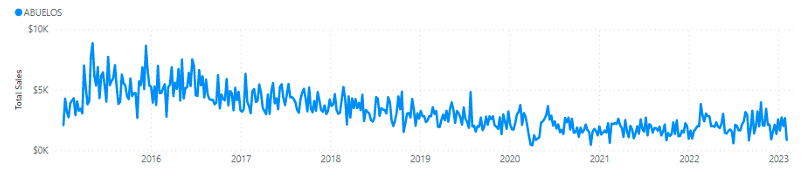
Meanwhile, traditional restaurants suffered from Covid-19 restrictions and consumer fears/concerns. From our database samples, traditional restaurants such as Abuelos, a Mexican food brand, had a large decline during the covid years.
Since fast food restaurants strongly dominate casual dining sales, the total spending trend on casual dining is basically following the spending trend on fast food restaurants. For detailed restaurant spending and dining data, see our data dashboard.
ConsumerCorner.2023.Letter.09