Chicken wings are popular in bars, at restaurants and (obviously) even in restaurant themes with the increasing number of restaurant chains devoted to the wing as its spotlight (or only) feature. Chicken wings began their rise to stardom as, well, chicken wings in 1964 when the first hot wings were served at the Anchor Bar in Buffalo, New York. Since then, the chicken wing has become famous enough to have its own USDA Agricultural Marketing Service infographics created.
As meat consumers, we tend to focus on a very small number of products or cuts from the whole carcass and seldom mention the rest. Some of which product is spotlighted is due to the retail channel we’re most familiar with or participating in presently. There’s also significant seasonality. Ham at Easter, beef tenderloin at Christmas, turkey for Thanksgiving, chicken wings for Super Bowl and March Madness, etc. The problem is, chicken wings come from whole chickens. From the perspective of processing livestock into food items, it seems simple and obvious, but from a markets perspective, this is a challenge.
Consumer demand differs for individual products or cuts of meat. For example, consumers demand more chicken wings or bacon. Well, the livestock sector cannot provide more bacon without providing more of everything else that comes from a pig. Meat is a complicated market in this way; you can’t make more of one cut without making more of others. And while you’re attempting to meet demand for one meat product, you’re potentially oversupplying another. Chicken wings aren’t widgets; you can’t make more chicken wings without making more chicken, no matter how valuable wings are on Super Bowl weekend. You also can’t make more chicken breasts without making more wings, even if those wings are going uneaten in March 2020 due to COVID-19 adjustments.
Chicken wing prices collapsed during the very early weeks of the COVID-19 pandemic. In April 2020, a headline read “An unlikely side effect of coronavirus: A national surplus of chicken wings”. At that point, my read on the market was that we love wings, but we tend to love them in restaurant and other public/social settings more so than buying them for at-home cooking alone. Simultaneously, we weren’t gathering at all, which meant we were leaving wings untouched, and prices fell to levels not seen since September 2011.
Then, they rallied back to normal…and kept going up, up and away. Then came the headlines arguing that demand was incredibly strong, and prices were high, but that we’re not in a state of actual ‘shortage’. One year later in April 2021, we’re screaming about ‘pandemic shortages’ for chicken wings after lamenting one year ago exactly that nobody wanted them: “Yet another pandemic shortage is here: Chicken wing prices are soaring, forcing restaurants to adapt”.
Seldom does a graph depicting product prices speak so loudly and obviously to rapid movements in the markets. I’ve annotated some graphs provided by the Livestock Marketing Information Center below:
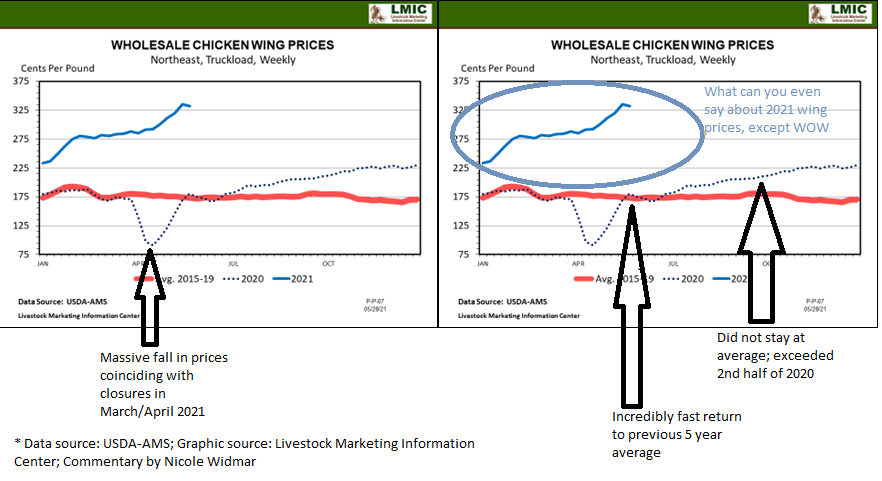
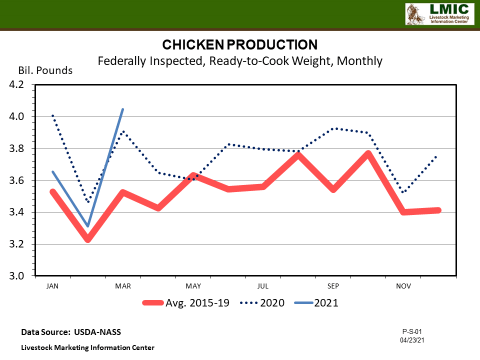
In one year we’ve gone from abundant supply alongside falling prices to wanting more (MORE!) alongside rapidly (and continuously!) rising prices. Given we know there were production challenges during this era due to COVID-19 shutdowns and plant closures, it is worth noting that chicken production was impacted in the spring of 2020. Wing markets aren’t developing in a vacuum — see the 2020 production levels noted below in the March-May timeframe, which fell off from their earlier 2020 peak but yet remained above the 5-year prior average.
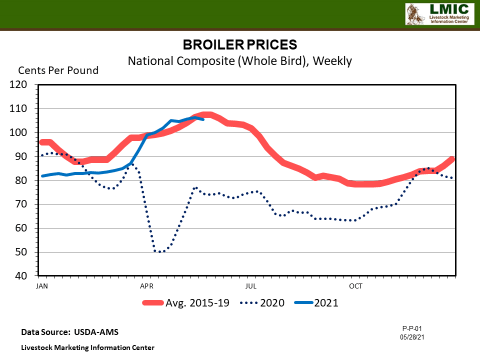
Whole chicken prices were impacted in notable and graphically visible ways, remaining below average for whole broilers nearly the entirety of 2020 after the initial impacts of the pandemic were felt in Q1.
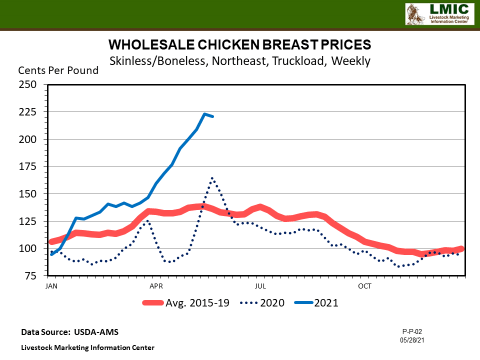
One may wish to see the prices of chicken breasts rather than whole birds when considering a point of comparison to chicken wing prices. Prices fell initially in response to the March 2020 domestic pandemic onset, then recovered rapidly before settling in just below the 5-year average price for 2015-2019. Chicken breast prices in 2021 have increased significantly, providing evidence of strong demand and relative market scarcity (see next graphic on cold storage), although not tracking identically to wing prices during this same time period.
Finally, I would be remiss to not acknowledge cold storage. One can clearly see that we drew down stocks of chicken in cold storage in March/April 2020 when production fell in response to plant closures and slow/shutdowns. Simultaneously, one can see that 2021 stocks of chicken in cold storage are below average, which is fueling, in part, our 2021 increasing chicken prices.
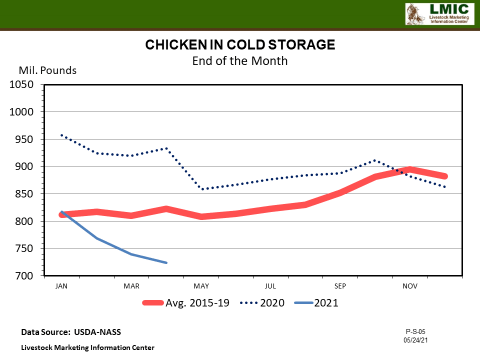
‘The market’ is responding in very predictable and expected ways to lower stocks of product on-hand — with rising prices. But individual products/cuts like chicken wings aren’t so simple…we can’t directly respond to a change in demand for chicken wings without altering the supply of everything else that comes from a chicken. Chicken wings come from actual whole chickens. Meat product markets are biologically governed in this way, which makes meat markets inherently ‘different’. Given the importance of meat and protein markets and the complicating factors surrounding meeting demand for individual products, continuous monitoring and study is warranted. In particular, in this period of rapid economic recovery with movement back into restaurants and food service, the meat markets are facing pressure to provide specific items to specific channels at specific times…and it’s simply not that simple.
ConsumerCorner.2021.Letter.20


