Author: Dr. Michael Delgado, Associate Professor, Department of Agricultural Economics, Purdue University

We learn in statistics classes that the size of our data sample matters. Then, we get “in the real world” and realize that our sample is too often at the mercy of outside forces — the sample that remains after merging data sources and dropping missing observations, or simply how many respondents completed the survey. We work with what we have, and sometimes this means working with a “small” sample. The question is: How small is too small? Then, the question becomes: Is it worth analyzing a sample that is too small? Regardless, we usually push ahead. And while we may have a list of reasons for doing so, it is worth putting ourselves back into the seat of our statistics class for a brief reminder on exactly how and why the size of the sample matters.
We use data to learn about features of the economy, typically in the form of unconditional and conditional averages (i.e., sample means and regression parameters), model estimation (e.g., estimating and testing a model of exponential growth) or distributional assessment (e.g., testing for a normal distribution). The sample is the “information” we have available, and it is used to estimate parameters and calculate statistical confidence intervals. It is intuitive that the more information we have — i.e., the larger the sample — the “better” our estimates will be. Statisticians confirm this intuition mathematically by studying the equations of statistical formulas to understand how statistical precision improves as the sample size grows.
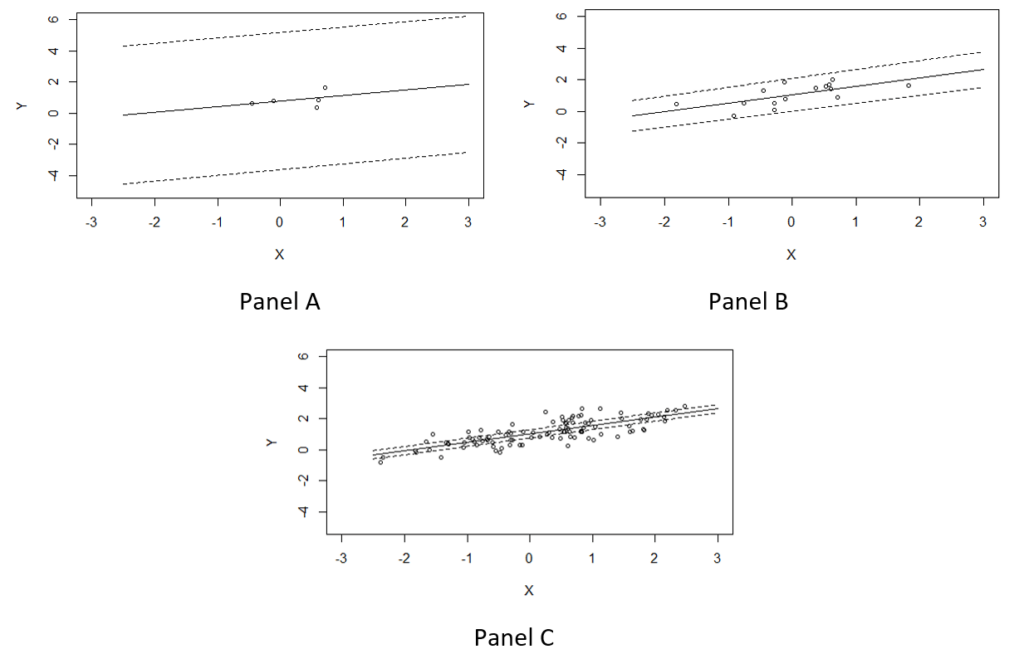
Mathematics proves that statistical estimates are increasingly accurate as the sample size grows, borne out in more precise estimates, as well as smaller standard errors that translate into increased statistical confidence. Take a simple example of a linear regression with a single variable, illustrated in the figure below. Each figure shows the sample, the linear regression fit (solid line) and the 95 percent confidence interval (dotted lines). Across the three panels, the regression model is exactly the same with the only difference being the sample size. In Panels A, B and C, the corresponding sample sizes are n=5, n=15 and n=100, respectively. It is evident from the examples that the confidence intervals narrow dramatically as the sample size increases, giving us more confidence in our estimates. The size of the confidence interval matters. It is evident in the first panel that the estimates are insignificant, because the relationship between X and Y is not statistically different from zero. As the confidence bounds tighten — as the sample size increases — the estimates become significant.
Better statistical confidence is the result of more precision, and this precision is essential for allowing a reasonable degree of confidence in extrapolation of our estimates into policy contexts. If, in conducting a policy analysis, we find that a certain policy did not significantly influence an important outcome, we would naturally recommend policymakers abandon the policy in favor of an alternative. This simple example illustrates how policy analyses based on too small a sample may lead us to an erroneous conclusion of recommending policy change when, in fact, the policy had been effective. There are many aspects of a good empirical analysis, and sample size is one of them.

Figure: Example of simple linear regression fits under different sample sizes of n=5, n=15 and n=100
ConsumerCorner.2021.Letter.05


