

Here at Consumer Corner, we take a keen interest in how holiday (or holiday-adjacent) events – and other magic-making moments (vacations!) – shape consumer behavior. We also have a history of investigating how consumers spend their money on food, including at restaurants, and on leisure. We have even examined what we eat for seasonal events like holidays. Sometimes preferences change; sometimes the tried-and-true remain steadfast, like the day of the year we collectively come together to seek a peppermint mocha. More specifically, it is December 12, which – five years in a row – marks the moment that interest in the peppermint mocha, as measured by Google web search data, begins to decline from its recent peak.
While “season” can be defined loosely, we should be able to agree it applies to anything regular and predictable, spanning more than a day, and not comprising the entire year. By that definition, we might consider the school year seasonal (even if it covers roughly nine of the twelve months).
Fresh off our recent review of the back-to-school season and its impact on foot traffic at local big-box stores in West Lafayette, Indiana, we wanted to examine back-to-school season on (or near) campus at Purdue University. This time, we focus on a locally owned, hole-in-the-wall watering hole for most Boilermakers: Harry’s Chocolate Shop. Founded in 1919 as an actual chocolate shop, this establishment obtained the first permit to sell beer in West Lafayette once Prohibition concluded. Located two blocks from the historic Purdue Memorial Union, Harry’s has been a frequent stop for students and alumni for more than 100 years.
We ran a nearby activity report on the area around Harry’s Chocolate Shop using Placer.AI. From August 1, 2018, through September 8, 2025, we observe daily visit counts for individuals passing within 250 feet of Harry’s. We also applied a filter to exclude anyone who does not remain in the vicinity longer than ten minutes. Effectively, commuters by car, foot, or other means are excluded. As are delivery drivers and probably most “to-go” pickup orders (unless they loiter more than ten minutes while waiting). Of course, not everyone in this area is going to Harry’s; there are numerous restaurants and shops nearby.
As with our discussion of back-to-school activity at Walmart, let us start by looking at a plot of daily visit counts.
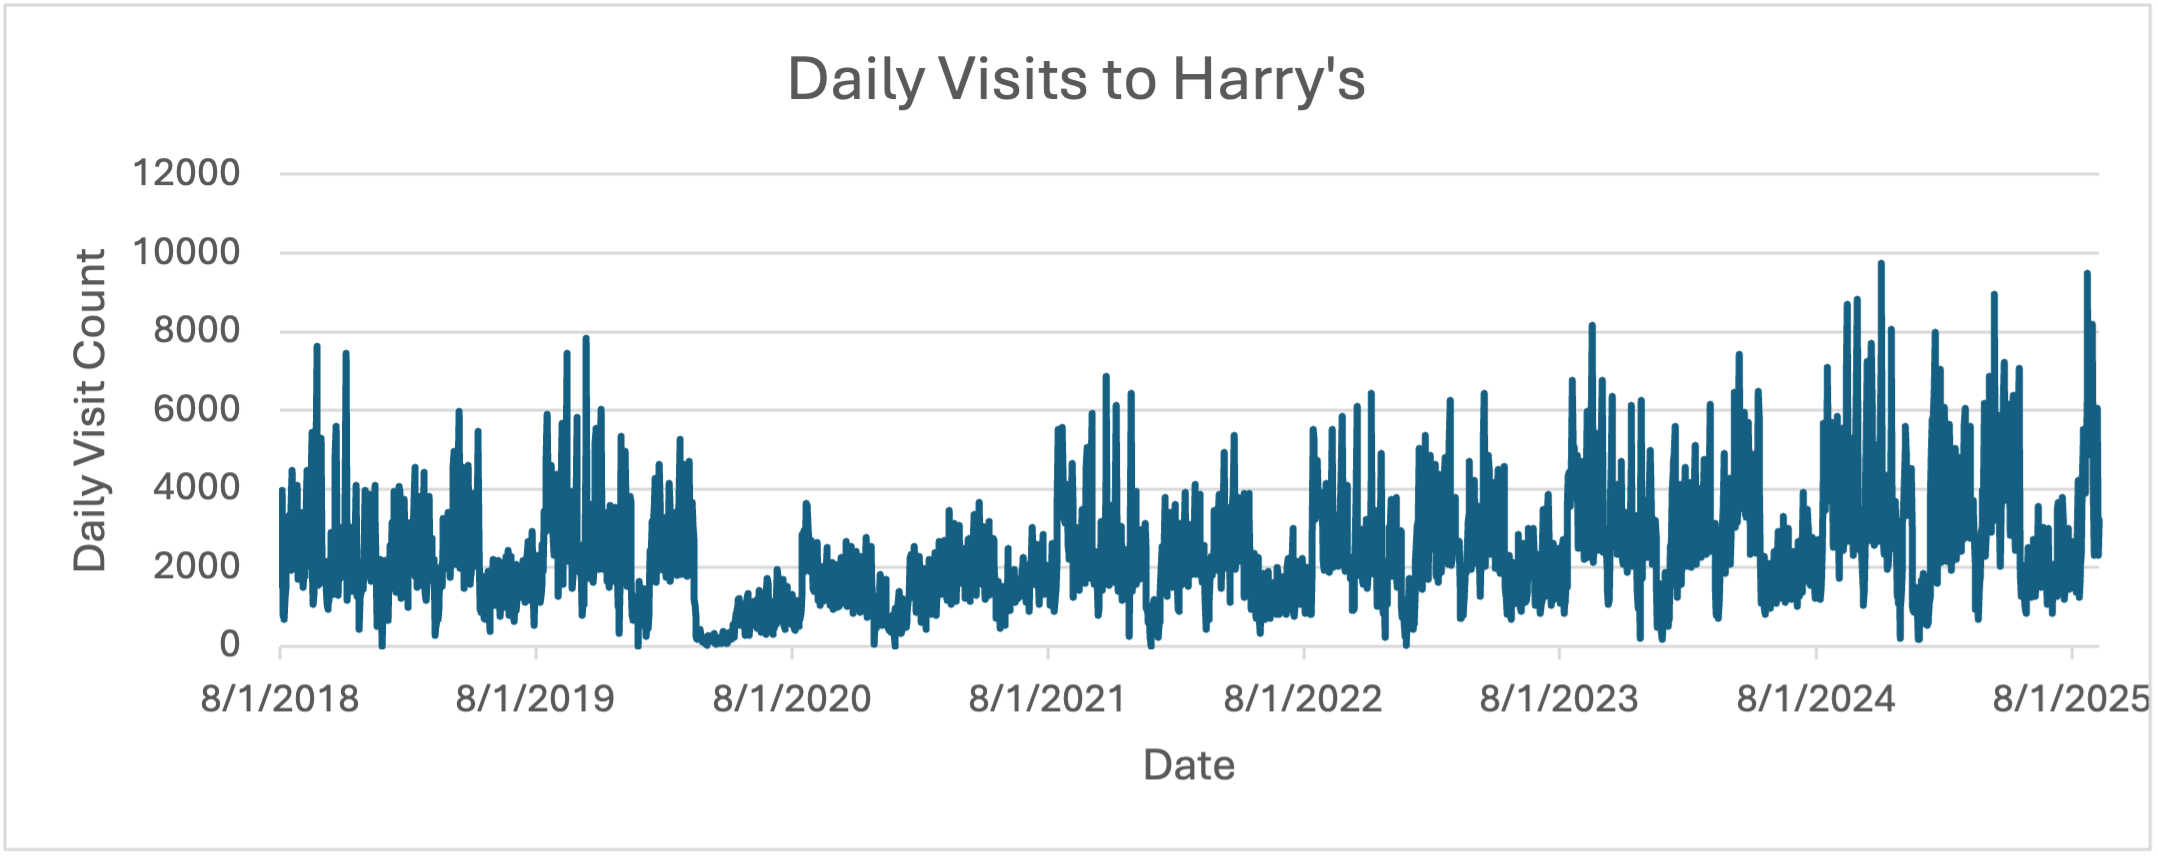
This graph is tough to read. The technical term is “noisy.” The visit counts jump up and down constantly, which is a big part of why the trend is hard to see. We also see a steep drop-off around March 2020 – when COVID-19 closures came to Indiana.
Now let’s look at a more digestible figure which aggregates visits by week.
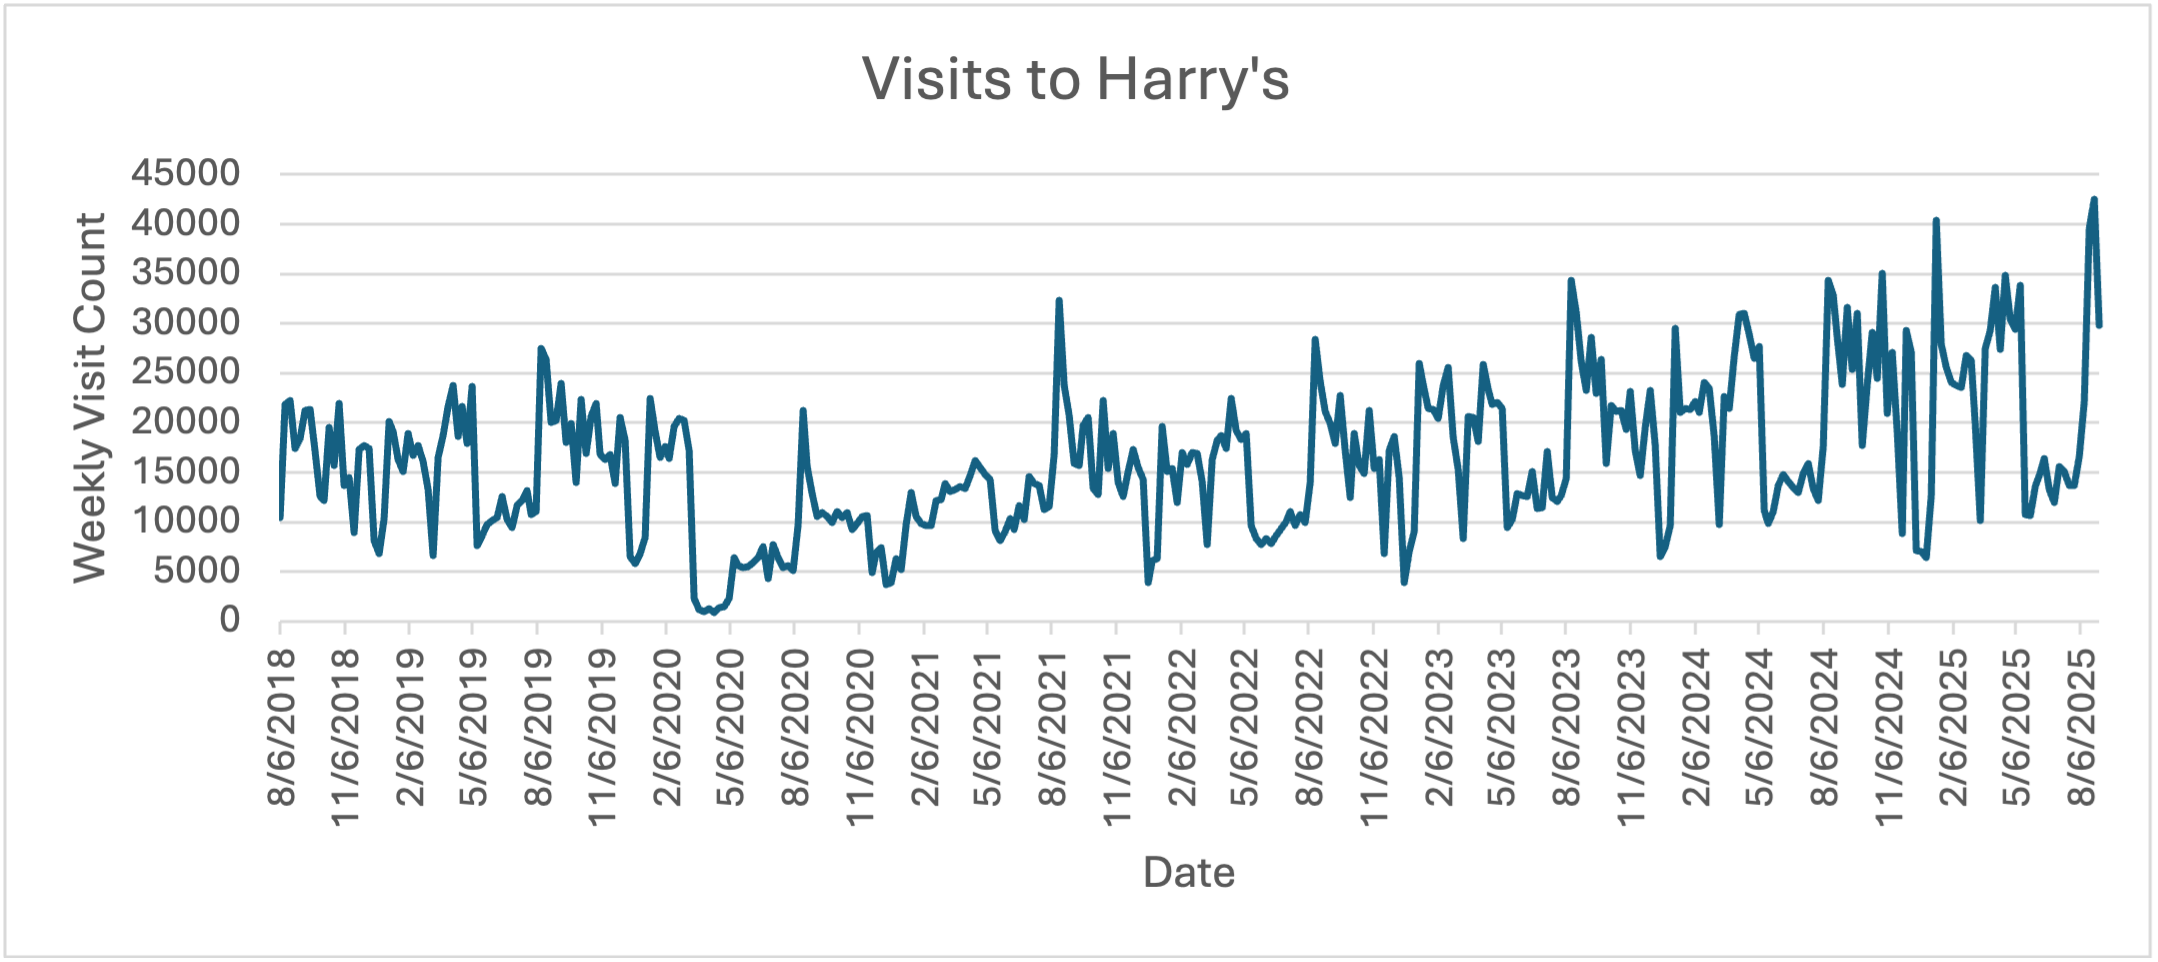
Weekly aggregation makes it much easier to see the visitor trends over this long timeframe. Notice we adjusted the x-axis to display dates in three-month increments. Using weekly data improves readability, but the variance contained within daily data is arguable one of the most interesting features. For now, let us look closer at visit counts, first examining total visits by year.
|
Year |
Sum of Visits to Harry’s |
|
(partial) 2018 |
347,952 |
|
2019 |
839,250 |
|
2020 |
478,698 |
|
2021 |
715,822 |
|
2022 |
767,740 |
|
2023 |
975,055 |
|
2024 |
1,100,834 |
|
(partial) 2025 |
815,235 |
|
Grand Total |
6,040,586 |
What is more impressive: the estimate that roughly six million people visited this area from August 1, 2018, to September 8, 2025 – or that an estimated 1.1 million people visited in 2024 alone? As expected, we see a COVID slump: 478,000 visiting in 2020. While it took some time, the campus community to have gotten “back to normal” by 2021 (if visits to the favorite pub are any indication). Let’s look between years at the average visits by month.
|
Month |
Average of Visit Count |
|
January |
73,869 |
|
February |
75,247 |
|
March |
68,878 |
|
April |
85,089 |
|
May |
62,574 |
|
June |
47,423 |
|
July |
51,603 |
|
August |
93,658 |
|
September |
86,518 |
|
October |
76,383 |
|
November |
68,716 |
|
December |
54,884 |
|
Monthly Average |
70,677 |
June and July stand out. These are the only months when most of the undergraduates are away from campus, and they show markedly lower traffic – 67% and 73% (respectively) of the monthly average. The two most common months for visits are August and September, with April close behind. There may be multiple explanations, including weather (for those who prefer warmth) and the timing of the academic calendar – close to the start and end of the school year. (The semester ends in early May, followed by mid-May commencement.) One last amusing way to look at our data is by average daily visits by weekday. Surely a studious population of Boilermakers would have predictable behavior here. Shown below, we also calculate the percent of the daily average and the percent of the weekly total (shown on the last row).
|
Day of the Week |
Average Visits to Harry’s |
Percent of Daily Average |
Percent of Weekly Total |
|
|
Sunday |
1901 |
82% |
10% |
|
|
Monday |
1765 |
76% |
9% |
|
|
Tuesday |
1914 |
82% |
10% |
|
|
Wednesday |
1968 |
85% |
11% |
|
|
Thursday |
2260 |
97% |
12% |
|
|
Friday |
3061 |
132% |
16% |
|
|
Saturday |
3417 |
147% |
18% |
|
|
Daily Average |
2327 |
100% |
100% |
|
Predictably, Harry’s sees crowds on Thursday, Friday, and Saturday. The fact that roughly one-fifth of weekly business occurs on Saturday is no surprise.
A few impressions are notable. First, establishments like Harry’s occupy a unique position where they depend on the student population that does not reside year-round in West Lafayette. Further, many individuals in this group do not stay longer than four years. Yet, the behavior of this population is remarkably predictable. They come to town in August and leave by mid-December, return in January, and leave again by early May. When they are in town, they go out on Friday and Saturday – especially at the beginning and end of semesters, which also tends to coincide with better weather. Is it the start of the semester or the fact that it isn’t snowing sideways? we don’t know.
Lastly, events that impact the ability of this population to be in town can cause issues for businesses like Harry’s. We saw a considerable decline in 2020, including nearly no visits during the March-May period.
In the end, we’ve documented something we already knew: people in West Lafayette love Harry’s Chocolate Shop. We also know that foot traffic there is seasonal, that the bar shines on Friday and Saturday nights, and that when campus is less populated, so is Harry’s. “Back to school” and “back to Harry’s” appear somewhat entangled, which is not shocking.
We have also learned that foot traffic data, along with its associated details (for example, where people come from and where they go afterward) is well grounded and makes perfect sense. It is also an area where we intend to continue to invest as a research group. Where will we (you) go next?