

Our last letter introduced an ongoing research project dedicated to understanding COVID-19 household-level impacts and mask wearing behaviors by U.S. residents. Throughout the project timeline from conception (April-May 2020) to data collection (June 2020) to analysis (June-July 2020), the “hot spots” or geographical areas with rising case counts have moved around the country. Thus, we are seeking to understand the differences in perceptions and behaviors surrounding masks in different geographical regions.
With the Fall 2020 semester fast approaching for Purdue University and Oklahoma State University, the focus on mask usage and protecting communities from COVID-19 near college towns has increasing real-time importance. For this supplementary analysis conducted exclusively for posting as ConsumerCorner.2020.Article.02, we look at perceptions and use of masks by residents of and around Purdue University’s Boilermaker territory versus residents of and around Oklahoma State University’s Cowboy territory. In other words, we seek to uncover how perceptions and use of masks in response to COVID-19 vary between two distinct geographies defined as presented in Figure 1.
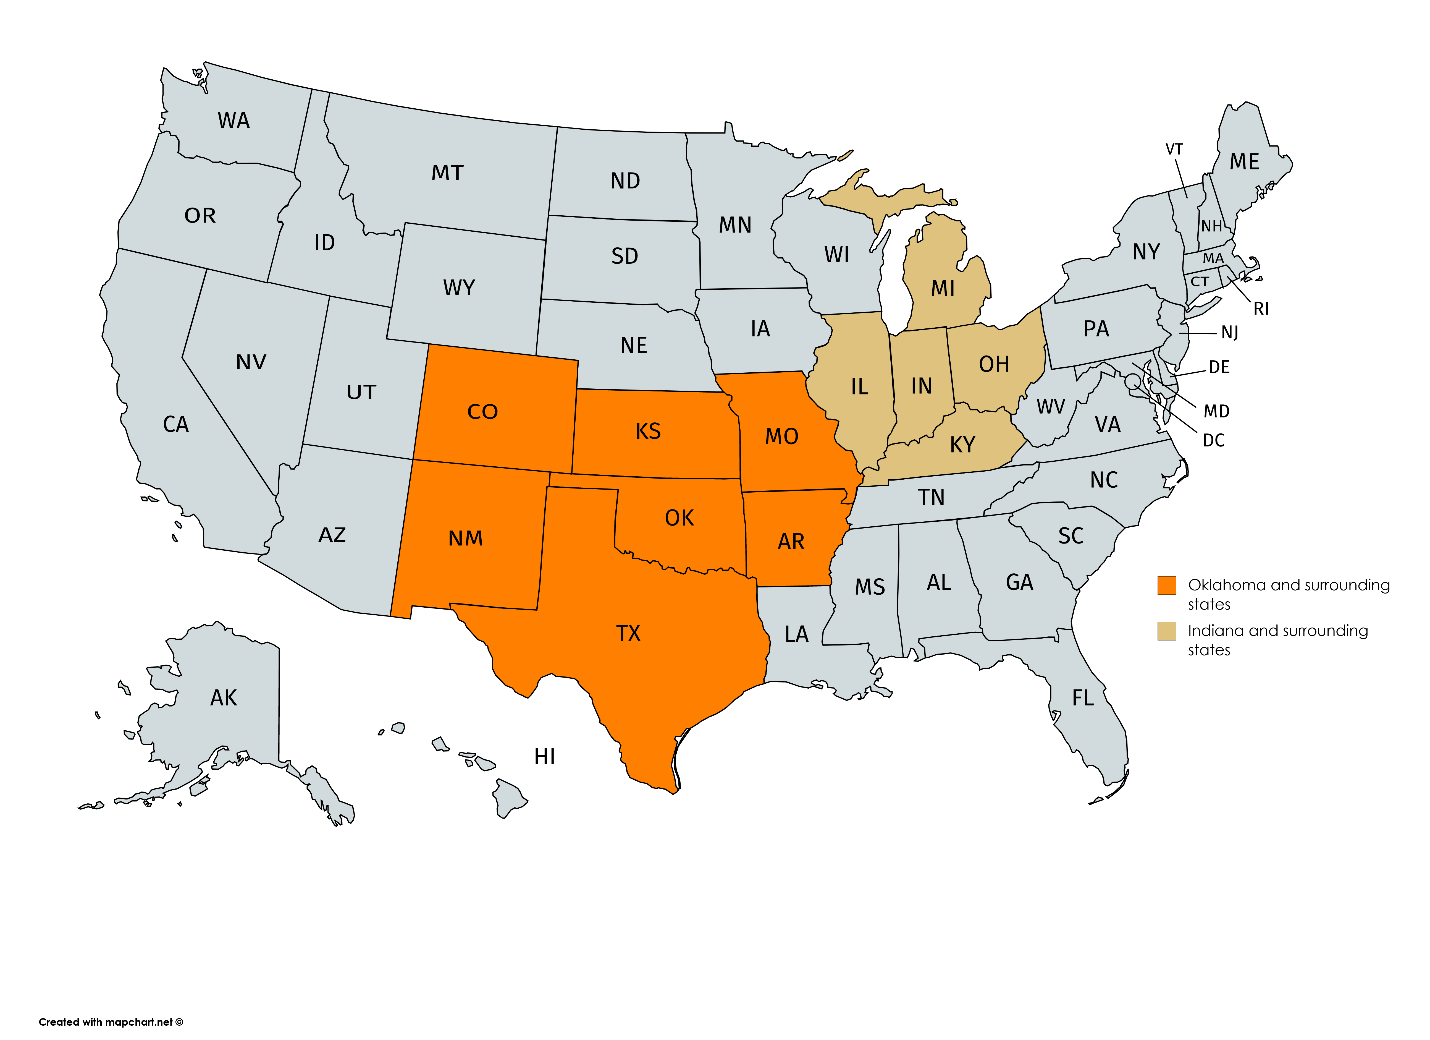 Figure 1. Indiana and surrounding states and Oklahoma and surrounding states.
Methods Employed & Analysis Conducted
Data were collected using an online survey from June 12, 2020 to June 20, 2020 as residents returned to some public places in much of the U.S.. Kantar [1]. A company which hosts a large opt-in panel database was used to obtain survey respondents who were required to be 18 years of age or older to participate. The research survey instrument was approved by Oklahoma State University IRB (number: 20-283). As COVID-19 spread is not impacted by state borders, this analysis took explicit account of states with shared borders, in recognition of the likely spillover effects from nearby states (Figure 1). This categorization resulted in two groups of states for Purdue University/state of Indiana: Indiana and the surrounding states of Michigan, Ohio, Kentucky and Illinois, and all other states (non-Indiana and surrounding states). There were two groups of states for Oklahoma State University/state of Oklahoma: Oklahoma and the surrounding states of Texas, New Mexico, Colorado, Kansas, Missouri and Arkansas, and all other states (non-Oklahoma and surrounding states).
The results of demographic questions were compared between Indiana (or Oklahoma) and the surrounding states and non-Indiana (or non-Oklahoma) and the surrounding states using the test of proportions [2]. Respondents were asked on a scale of 1 (not impacted) to 5 (impacted) the level of impact from COVID-19 they experienced for 5 different daily activities. The mean responses were compared between the states and the surrounding states studied and the non-surrounding states using a t-test [3, 4].
Respondents were presented with the question: “Do you agree that masks (meaning any face covering that covers your nose and mouth) have any role in U.S. society related to the spread of viral disease, especially COVID-19, in the June – December 2020 time frame?” and could select the answer choice “No-they have absolutely no role whatsoever in U.S. society”, or “Yes-they have some potential role in U.S. society.” Respondents were also asked a series of questions related to beliefs surrounding masks ranging from “Wearing a mask helps prevent the spread of COVID-19” to “Wearing a mask has negative health consequences for the mask wearer.”
Respondents who believed masks had a role in U.S. society were asked a follow up set of questions regarding their behavior in specific locations. If respondents indicated the location was open in their community, and that it was a location they attended, the percentage of respondents who indicted they wore a mask voluntarily, they were required to wear a mask or they did not wear a mask was tabulated and statistically compared. Respondents were also asked on a scale of 1 (strongly disagree) to 5 (strongly agree) their level of agreement that someone in their household, or that they frequently spend time with is at a higher risk of complications of COVID-19, and the level of agreement that the respondent was at a higher risk. The mean response for the two questions for each state grouping is reported and a t-test was used to statistically compare Indiana (or Oklahoma) and the surrounding states and non-Indiana (or non-Oklahoma) and the surrounding states.
Findings
* Note that the Indiana and surrounding states findings can be downloaded as a single packet of results tables here, and the Oklahoma and surrounding states findings can similarly be downloaded here. An in-depth article about Oklahoma and the surrounding states can be found here from Oklahoma State University.
Before delving into COVID-19 specific responses/data, it is useful to compare/contrast demographics of respondents between the Indiana and surrounding states versus the rest of the country, as well as the analogous comparison for the Oklahoma and surrounding states grouping. Table 1 summarizes demographics for respondents for both geographies revealing Indiana and surrounding states had statistically less people in the income range $75,000-$99,999 than the rest of the country. Oklahoma and the surrounding states had a higher percentage of respondents aged 18-24 and a lower percentage of respondents who were 65+ when compared to the rest of the country.
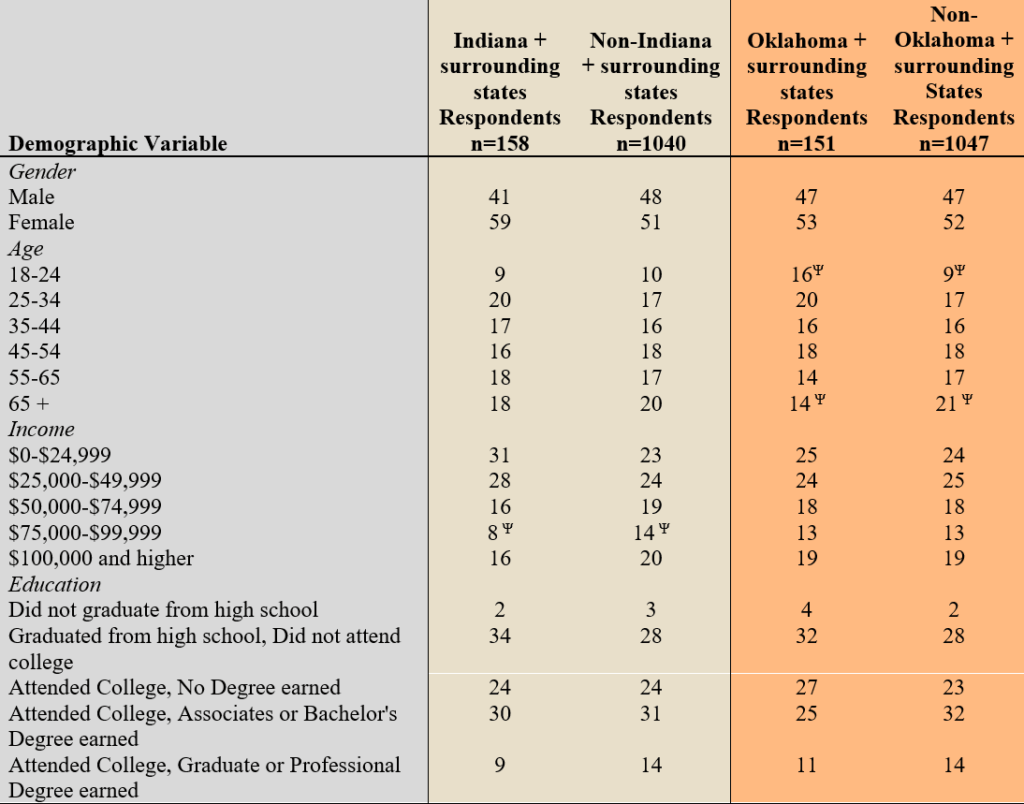 Table 1. Demographics for Indiana and surrounding states and Oklahoma and surrounding states (percent of respondents).
ΨIndicates the percentage of respondents from that category from that state and surrounding states is statistically different than non that state and surrounding states at the <0.05 level.
Respondents from Indiana and surrounding states indicated a lower level of impact for the ability to find meat, milk and perishable grocery items when compared to the other activities studied (Table 2). Furthermore, respondents from Indiana and the surrounding states indicated a lower level of impact for the ability to find meat, milk and perishable grocery items when compared to the rest of the country. Oklahoma and the surrounding states indicated they experienced a lower level of impact related to ability to find meat, milk and other grocery items including paper products when compared to all other activities studied. Oklahoma and the surrounding states indicted they experienced a lower level of impact related to the ability to find paper products when compared to the rest of the country.
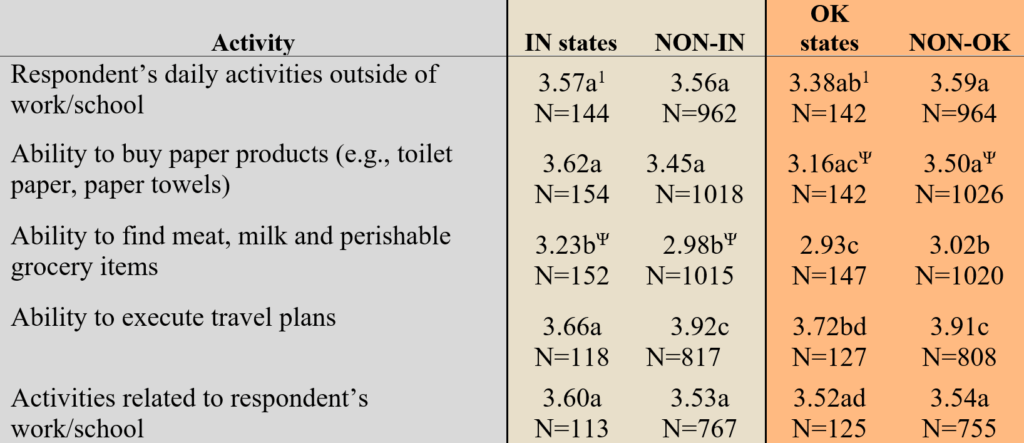 Table 2. Mean response on a scale of 1 (not impacted) to 5 (impacted) for each activity for respondents who did not respond that the activity did not apply to them (i.e. they were never planning to travel in the first place).
1Matching letters indicate the mean is statistically different down the column. For example, the mean for Indiana and the surrounding states for the activity respondent’s daily activities outside of work/school is statistically different than the mean response for activity ability to find meat, milk and perishable grocery items but not statistically different for the activity ability to buy paper products at the <0.05 level.
ΨIndicates the mean is statistically different between the either Indiana or Oklahoma and surrounding states and either non-Indiana or Oklahoma and the surrounding states for that activity at the <0.05 level.
Table 3 quantifies the percent of respondents agreeing with various statements about mask wearing in the U.S. in 2020. For all four samples investigated, a majority (79-84%) of respondents believed that masks have some potential role in U.S. society related to the spread of viral disease, especially COVID-19. A higher percentage of respondents from Indiana and the surrounding states compared to the rest of the country believed that wearing a mask has negative health consequences for the mask wearer. A lower percentage of respondents from Oklahoma and the surrounding states believed wearing a mask helps prevent the spread of COVID-19, helps prevent individuals from getting COVID-19 and will prevent future lock-down related to COVID-19 when compared to the rest of the country. A higher percentage of respondents from Oklahoma and the surrounding states believed that wearing a mask does not prevent the spread of COVID-19 and that it has negative health consequences for the wearer when compared to the rest of the country.
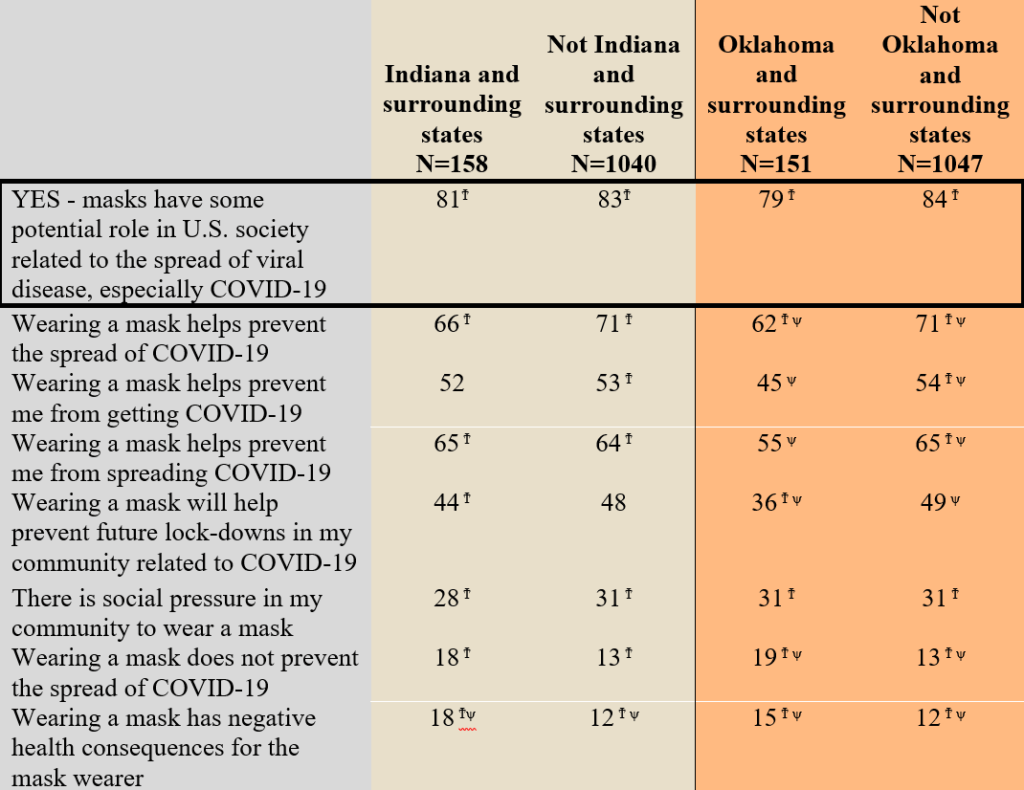 Table 3. Percentage of respondents who agree with mask-related statements.
ϮIndicates the percentage of respondents is statistically different between those who selected they agreed with the statement and those who did not at the <0.05 level. Those who did not select that they agreed with the statement and those who did sum to 100% within a category (i.e. Indiana and surrounding states) were not included for brevity with the exception of the role of masks in society.
ψIndicates the percentage of respondents between the two levels within a category. For example, men vs. women, or high total vs. not high total are statistically different at the <0.05 level.
Table 4 delves into various public places and mask wearing behavior. Of the respondents who indicated masks had at least some role in society and did attend the location, a higher percentage of respondents from Indiana and the surrounding states voluntarily wore a mask in a big box grocery store, specialty grocery store, home improvement store, clothing store and a retail store other than grocery clothing or home improvement when compared to the rest of the country. A higher percentage of respondents from Oklahoma and the surrounding states who believe masks have a role in society and can and do attend the location do not wear a mask at in-person religious services, big box grocery stores, restaurants and retail stores other than grocery, clothing or home improvement when compared to the rest of the country.
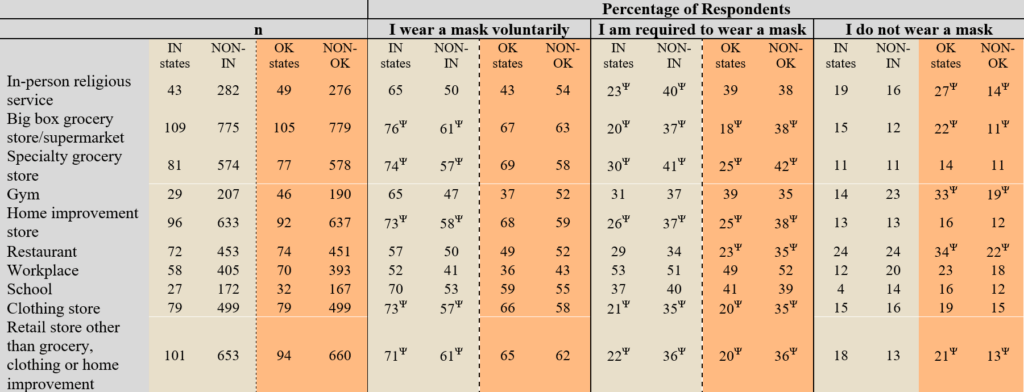 Table 4. Mask wearing behavior of respondents who go to a location and had the opportunity to go to a location (i.e. the location was open in their community). Percentage of respondents, n given in table.
ΨIndicates the mean is statistically different between Indiana and surrounding states and non-Indiana and the surrounding states for that location and column at the <0.05 level. For example, the percentage of respondents from Indiana and the surrounding states who voluntarily wear a mask in big box grocery store/supermarket is statistically different than non-Indiana and the surrounding states.
Finally, one can certainly understand the potential for high-risk individuals or those spending time with high risk individuals to be concerned about COVID-19 transmission. Table 5 quantifies the self-reported high risk classification of respondents and those around them; Figures 2 and 3 visualize this data. The mean level of agreement that the respondent themselves or that someone in their household, or that they frequently spend time with is at a higher risk of complications of COVID-19 was not statistically different between those in Indiana and the surrounding states and the rest of the country. In contrast, respondents from Oklahoma and the surrounding states had a lower level of agreement that someone in their household or that they frequently spend time with is at a higher risk of complications of COVID-19. Respondents from Oklahoma and the surrounding states also had a lower level of agreement that they are at a higher risk of complications of COVID-19.
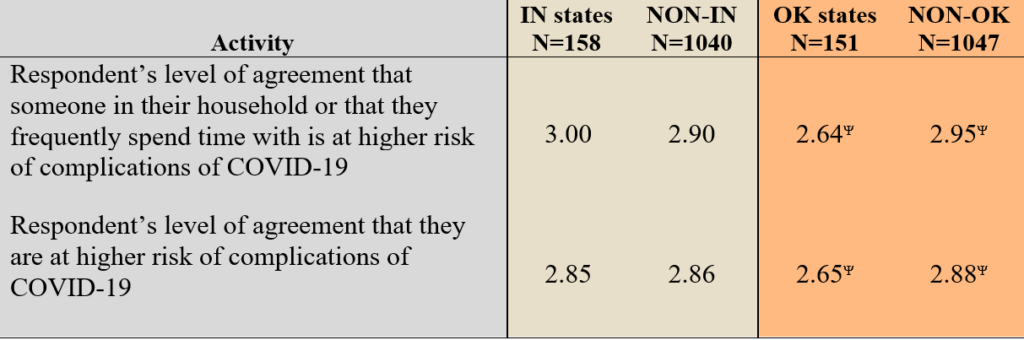 Table 5. Mean response from a scale of 1 (strongly disagree) to 5 (strongly agree) of respondent’s level of agreement with the following statements.
ΨIndicates the mean is statistically different between either the Indiana or Oklahoma and surrounding states and either non-Indiana or Oklahoma and the surrounding states for that activity at the <0.05 level.
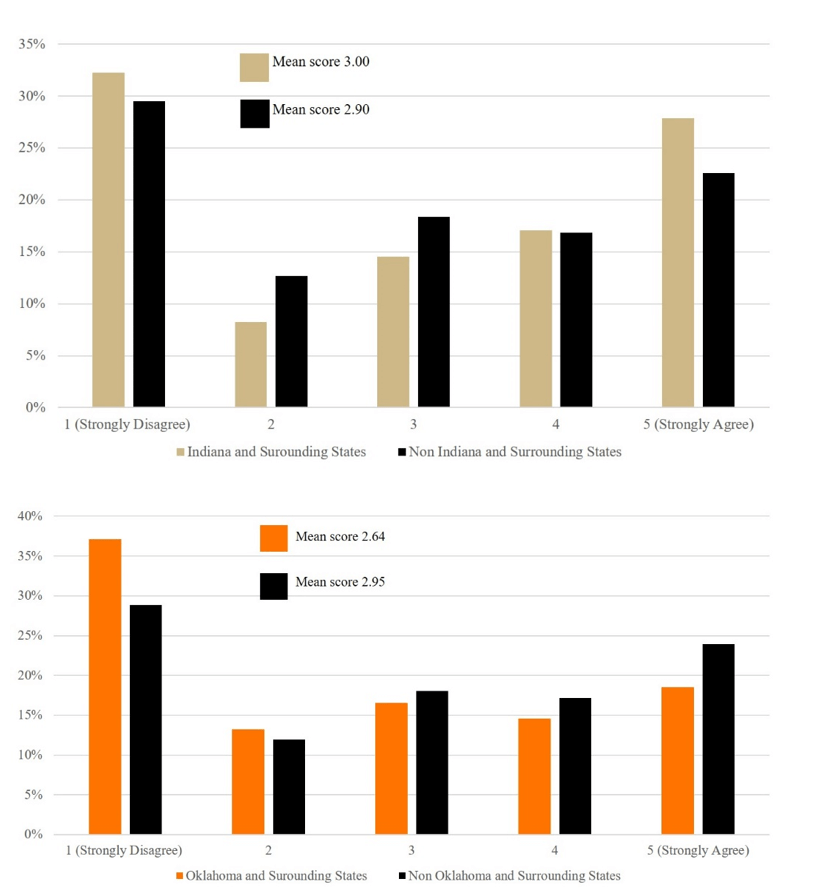 Figure 2. From a scale of 1 (strongly disagree) to 5 (strongly agree) respondent’s level of agreement that someone in their household or that they frequently spend time with is at higher risk of complications of COVID-19.
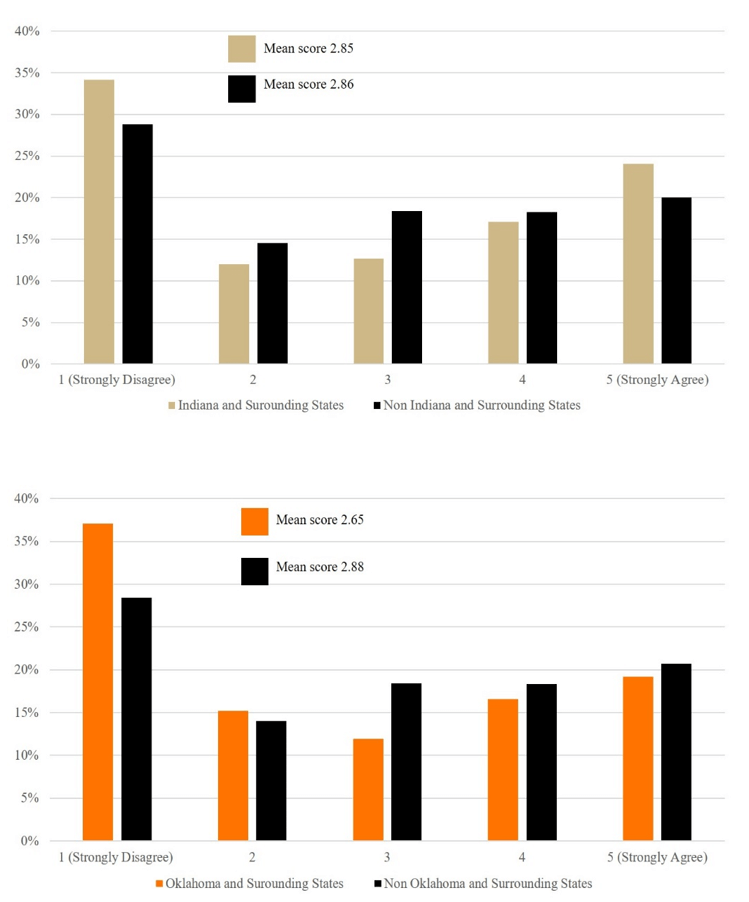 Figure 3. From a scale of 1 (strongly disagree) to 5 (strongly agree) respondent’s level of agreement that they are at higher risk of complications of COVID-19.
References
[1] Kantar. About Kantar. Kantar. 2020 [cited 2020 Jun 29]. Available from: https://www.kantar.com/about
[2] Acock, A. C. A Gentle Introduction to Stata 6th ed. College Station: Stata Press; 2018.
[3] Gosset, WS. The probable error of a mean. Biometrika. 1908; 6: 1–25.
[4] Welch, BL. The generalization of ‘student’s’ problem when several different population variances are involved. Biometrika. 1947; 34: 28–35.