 Authors: Dr. Nicole Olynk Widmar, Associate Head and Professor, Purdue University Department of Agricultural Economics
Dr. Courtney Bir, Department of Agricultural Economics, Oklahoma State University
We know that our words matter. We also know that a picture is said to be worth 1,000 words, and we use pictures in marketing materials and to convey information all the time. But do we really know what those pictures are conveying?
We recently sought to evaluate U.S. resident interpretation of a series of pictures of tomatoes either labeled with words or unlabeled.
What we learned is that words do indeed matter! And what individuals associate with various pictures/images is important to understand for making business decisions as a producer, marketer or retailer in agricultural and food supply chains.
Perhaps the most obvious visual appearance products for initial study in consumer markets are produce. Indeed, visuals are often used in marketing, and consumers evaluate products visually more so than other food items which may be packaged or concealed in boxes.
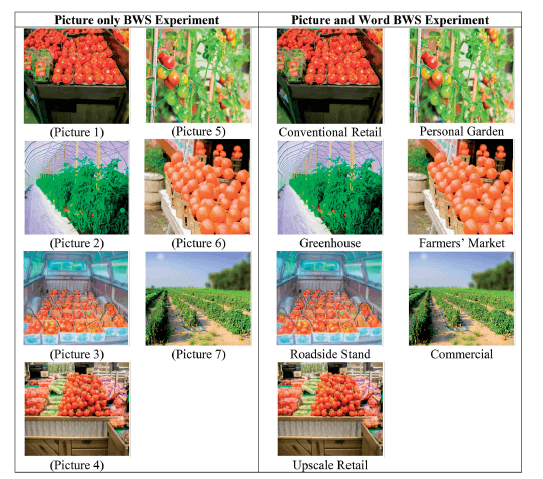
We developed two distinct choice experiments in which respondents were asked to select the most appealing and the least appealing photo of tomatoes. The only difference was that in one experiment, respondents saw only the photos, and in the other, respondents saw the photos with labels (words). We learned when respondents were show only pictures, tomato Picture 1 had the largest mean preference share (for which a higher number=more appealing or more preferred). But when the same images were presented with words, Personal Garden (Picture 5) and Farmer’s Market (Picture 6) became the first and second most appealing tomato images, whereas Picture 1 fell to third place. The associated words mattered in terms of the average preference placed on the different images.
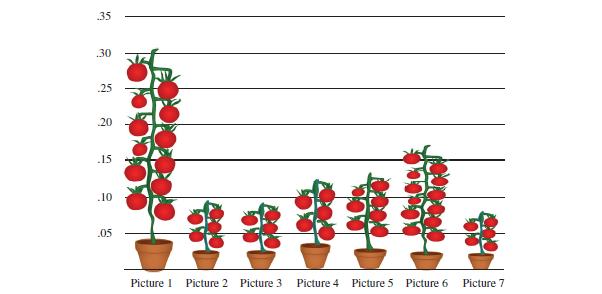 Mean preference shares (estimated relative amount of preference, higher = more preferred) allocated to pictures 1 through 7 when pictures where shown to respondents unlabeled (no words) n=602
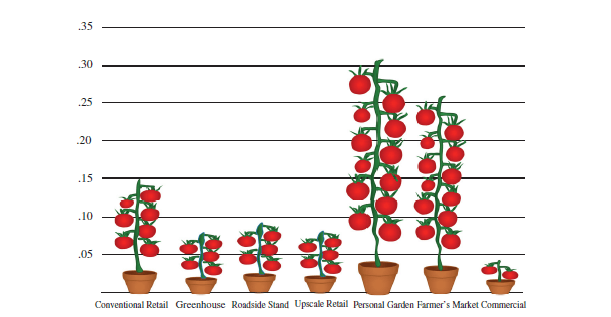 Mean preference shares (estimated relative amount of preference, higher = more preferred) allocated to pictures 1 through 7 when pictures where shown to respondents labeled (with words) n=508
Images or ‘looks’ are inherently linked to shopping decisions that consumers make through visual inspection of items like produce. To better understand the associations individuals made with the pictures employed in the experiment, we asked respondents to select among a list of characteristics which words they associated with the pictures studied. The word associations for the top pictures are presented below — the full set of word associations can be found in the published article.
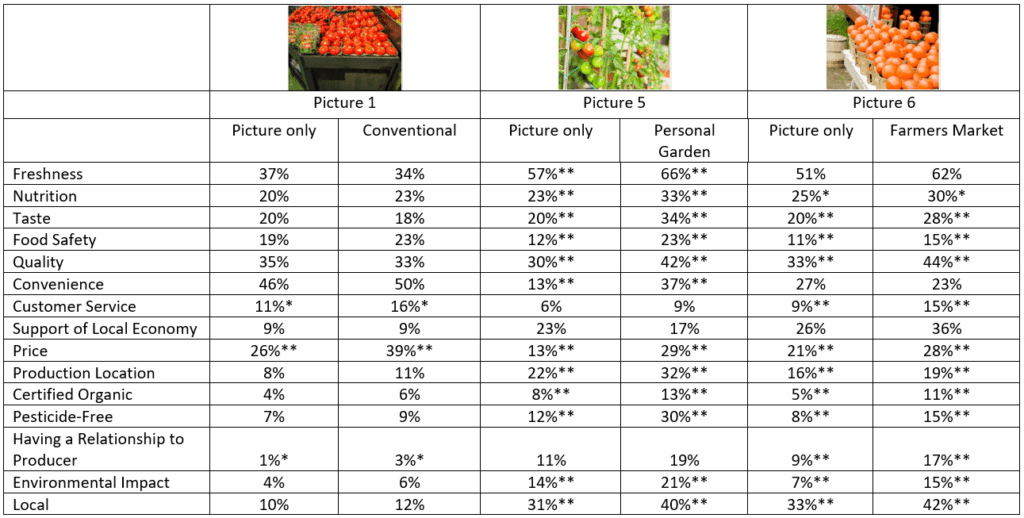 Table of word and picture associations, percentage of respondents who selected the tomato attribute when presented with each picture. Picture only BWS n=602, Picture and word BWS n=598
(Only Subset of Results Shown; For Full Table of Word Associations See Bir, Lai, Thompson, and Widmar, 2021)
*The percentage of respondents in the picture only BWS group who selected that attribute to describe that picture is statistically different than the percentage of respondents in the picture and word BWS group at the .1 level, **at the .05 level.
Recall from Mario Ortez’s Thoughts on Value, Cost, and Price Consumer Corner letter, “Regardless, the cost did not determine the price in the retail setting, nor the value of the product … your target market absolutely does not care about how much it cost you to provide it when they decide how much they are willing to pay for your product.” What’s clear from this research is that pictures mean things to consumers, different things than when we associate words with those pictures. While marketing materials with colorful imagery are the norm, do you really know what those images are saying to your prospective customers, stakeholders or the public? Even if you know what they mean to you, we posit that you may not actually know what they mean to others … Food for Thought.
The Research Cited is Summarized Visually
The results presented are from the recent publication: Courtney Bir, John Lai, Nathanael M. Thompson & Nicole Olynk Widmar (2021): Evaluating the Inclusion of Words and/or Pictures in Best-Worst Scaling Experiments, Journal of International Food & Agribusiness Marketing, https://doi.org/10.1080/08974438.2021.1900014
ConsumerCorner.2021.Letter.14