Purdue Agribusiness Review, Volume 1, Issue 3
Each year, numerous agtech startups and established firms promote the adoption of digital and biological technologies at the farm level. These organizations invest in pilots, sales teams, training materials and (in some cases) financing initiatives to reduce barriers to entry and foster acceptance. Despite these efforts, the adoption rates of technologies such as precision agriculture, remote sensing tools, artificial intelligence devices and e-commerce platforms for purchasing inputs remain low in both the United States and other countries (Malone et al., 2026; McFadden et al, 2023).
Conventional explanations often attribute low adoption rates to the specificities of agriculture, implying a longer, more complex adoption process that diverges from timelines observed in other technology sectors. These include returns that are highly dependent on biological processes, agricultural production cycles and extensive technical validation, among others. Additionally, some resistance to change among farmers is often discussed. However, these factors represent only part of the explanation.
An important dimension has received comparatively little attention. Most adoption and commercialization strategies implicitly target an “average” or generic farmer. Nevertheless, in practice, technology adoption is a highly heterogeneous process shaped by diverse productive, strategic and socioeconomic contexts. Producers vary significantly in their behavior, decision-making processes, priorities, risk perceptions and preferred information channels. Overlooking this heterogeneity can reduce the effectiveness of strategies intended to promote the adoption and scaling of agricultural innovations. In this sense, much of the adoption gap may stem from a landscape of fragmented solutions that fail to communicate their benefits in terms relevant to each type of farmer.
Drawing on data from a survey of 880 farmers in Argentina’s Humid Pampa[1], a globally significant agricultural region, we examined technology adoption across four domains: digital technologies, precision agriculture, biomass valorization and online input purchasing. We developed a typology of farmers based on their willingness to adopt these technologies. Although the results are based in Argentina, they have direct implications for the design of adoption strategies in other contexts. Our analysis challenges the notion of the average farmer and proposes that technology adoption is far from homogeneous. Rather, distinct adopter typologies emerge, each with unique characteristics, as discussed later in this article.
[1] This survey, known as the Argentine Farmer Needs Survey (ENPA, by its Spanish acronym), is the Argentine counterpart of Purdue University’s Large Commercial Producer Survey (LCP). Data for this article came from the survey carried out during June and July of 2021 on 880 farmers in the main agricultural provinces of Argentina (Buenos Aires, Córdoba, Santa Fe and Entre Ríos). These farmers are representative of around 85% of the soybean production in the main agricultural area of the country. The results from the latest wave (2025), to be released in 2026, will provide additional and substantially more detailed information on technology adoption patterns.
Moving beyond the average farmer
Many companies and startups structure commercial and communication strategies around an “average” farmer because a single value proposition, marketing message and distribution channel is simpler and less costly than tailoring strategies for multiple farmer segments.
Aggregate adoption rates can reinforce this tendency by obscuring who adopts, who does not and how those groups differ (Fiocco et al., 2023). The result can be product, positioning and communication strategies that miss the needs of meaningful customer segments.
The innovation process can compound the problem. Agricultural technologies often originate from scientific research or engineering advances, leaving market segmentation and heterogeneous farmer needs underemphasized early in development.
Commercial performance matters as well. Quarterly or annual adoption targets can favor customers already near adoption, while more differentiated strategies may require greater upfront investment and longer timeframes to develop segments with greater medium-term growth potential.
Four types of adopters and what each one tells us
To test this idea, we grouped farmers by behavior across the four technology verticals surveyed (digital, precision, biomass and online purchasing), using cluster.[1] analysis to identify subgroups that are internally similar and distinct from one another.
The first relevant data point is adoption by vertical, taken in isolation:
- 53% of farmers use some digital technology (satellite crop monitoring, drones, online weather tracking).
- 32% have adopted at least one precision-agriculture technology (variable-rate seeding or fertilization, precision irrigation or spraying).
- 31% have explored e-commerce tools to purchase inputs, and 21% purchased that way.
Only 20% are involved in biomass transformation (biofuels, biogas, waste valorization).
[1] Cluster analysis refers to a comprehensive set of techniques for finding subgroups in a data set. We apply cluster analysis in this work to divide Argentine farmers into different groups or clusters by their stated willingness to adopt new technologies. In this sense, farmers that belong to each cluster are as similar as possible to each other and as dissimilar as possible to the observations in other clusters.
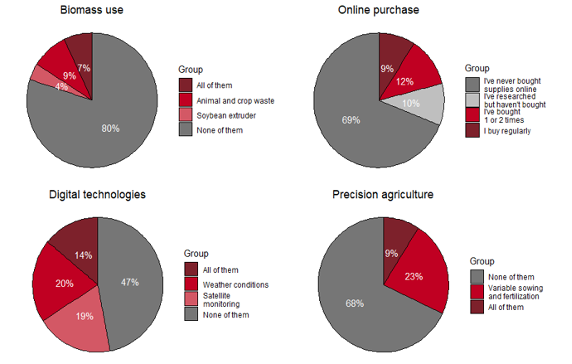
The central contribution emerges when we examine each farmer’s behavior across all four verticals simultaneously. Four clear profiles emerge:
- High adopter: these farmers adopt technology across all four verticals. This is the smallest segment, representing 5% of the sample.
- Simple adopter: this group adopts every available technology but focuses entirely on a single vertical. They represent 25% of the farmers.
- Low adopter: these farmers adopt at least one technology in some vertical but have not fully integrated into any of them. This is the largest segment, accounting for 45% of the total.
Non-adopter: this segment adopts no technology in any of the four verticals, making up the remaining 25% of the sample.
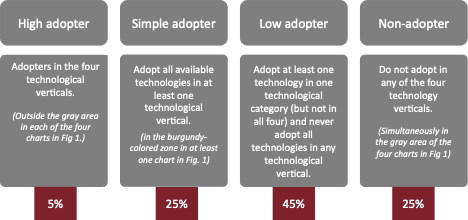
Put differently, three out of four farmers adopt at least one technology, but for most, adoption is partial, selective and dispersed across product categories. This does not imply a lack of adoption; rather, it suggests that adoption is neither uniform nor linear. Instead, it follows diverse pathways that reflect farmers’ specific production systems, strategic priorities, and decision-making processes.
Identifying farmer profiles
How can a salesperson or commercial team in practice tell which profile they are most likely dealing with? Table 1 already offers a first hint. Factors such as age, farm size and whether the producer systematically carries out financial planning can provide useful supporting context, but they should not be treated as definitive criteria.
Table 1. Farmers’ characterization according to their level of technology adoption
|
Group |
% below 45 years old |
Financial Planning (%) |
Full technology adoption (%)[1] |
Median size |
Most valued information source |
|||
|
Biomass use |
Digital technologies |
Precision agriculture |
Online purchase |
|||||
|
Non-adopter |
48 |
52 |
0 |
0 |
0 |
0 |
500 ha |
Field days |
|
Low adopter |
59 |
56 |
0 |
0 |
0 |
0 |
600 ha |
Field days |
|
Simple adopter |
62 |
78 |
22 |
46 |
29 |
26 |
800 ha |
Field days |
|
High adopter |
88 |
98 |
28 |
60 |
45 |
57 |
875 ha |
|
But descriptive signals are only the starting point. A brief conversation of no more than five minutes, without the need for a formal questionnaire, may reveal helpful information about the farmer’s current adoption pattern. Simple, direct questions about using digital tools to monitor crop status, variable-rate technologies or online platforms to purchase inputs may begin to reveal a farmer’s propensity toward technology adoption. The key is not to use these questions to immediately offer a pre-packaged solution, but to open a genuine dialogue: understand where they are in their adoption process and, from there, build the commercial conversation. Many new technologies are co-built with farmers rather than offered as a closed package, and the dialogue with the farmer needs to reflect that. Table 2 summarizes this logic in a form that connects current adoption behavior, the profile it most likely resembles and how the commercial approach should shift accordingly. It offers a starting heuristic rather than a definitive classification rule.
Table 2. Adoption patterns and suitable approaches
|
Current adoption pattern |
Profile it likely resembles |
Suitable approach |
|
No technology adopted across any vertical; smaller farm; little or no formal financial planning |
Non-adopter |
Assess whether the first conversation should be about financing or farm management, not technology |
|
At least one technology in use, but never fully adopted within any single vertical |
Low adopter |
Focus on spotting specific frictions (cost, support, fragmentation) preventing a higher adoption level |
|
Adoption of several solutions within one vertical, no presence in the others |
Simple adopter |
Use the vertical they already trust as a bridge for potential cross-selling in a different vertical |
|
Full adoption across three or four verticals |
High adopter |
Reinforce trust; offer deeper integrations, referral programs, or co-development. |
Purchase history may also provide useful clues about a farmer’s adoption pattern. Technologies are not necessarily adopted in isolation, and a producer’s prior purchases can help a commercial team understand where deeper adoption may be most logical. A farmer who has already acquired a precision agriculture tool, for example, may represent an opportunity for deeper adoption within that same vertical, even if the producer is currently classified as a low adopter because adoption remains partial across the four verticals considered.
It is important to be honest about the scope of our approach. Our analysis does not unambiguously assign a producer to one of the four categories. It is not a pre-designed tool. Instead, it facilitates dialogue and helps us understand each farmer’s current adoption behavior as a starting point, rather than assuming a uniform pattern or offering, from the first interaction, a packaged solution that does not match their level of technological maturity.
[1] Percentage of farmers who adopt all the technologies in each vertical.
The strategic implications of heterogeneity in adoption behavior
The most immediate implication of our analysis is the need to understand better which type of farmer is being targeted and to tailor communication and engagement strategies accordingly. Different farmer segments vary in their objectives, risk profiles, decision-making processes and information preferences, making a one-size-fits-all approach unlikely to be effective.
Although the proposed typology is preliminary rather than definitive and serves as a basis for the discussion, it provides a useful framework for thinking about farmer heterogeneity, which should inform the design of more targeted commercialization and communication strategies. The high adopter does not need to be convinced to adopt technology, as they already are. To illustrate this with a simple analogy, think about the long lines that form outside technology stores whenever a new iPhone or another highly anticipated gadget is released. These farmers are the ones at the very front of that line. The objective with this segment is retention and depth: offering more sophisticated integrations, referral programs or co-development of solutions (Table 2). These producers can also serve as opinion leaders or trusted sources of information for their peers, as technology adoption is often driven by peer-to-peer interactions (Khanna et al., 2024).
As shown in Table 2, the simple adopter, who has already shown a willingness to fully commit to one technology vertical (according to our data, 25% of the sample, which is a sizable group), represents a cross-selling opportunity: identify which vertical they already trust and use that trust as a bridge into a second vertical, rather than selling them a complete technology package upfront. The low-adopter segment is the largest and probably the most underestimated. This farmer is not resistant to change, as they have already adopted something in their operations. The problem is not willingness but rather friction (i.e., perceived costs, lack of support, and fragmented solutions that do not talk to each other). For this segment, the focus is solving the specific friction that keeps them from moving from partial to complete adoption within a vertical.
The non-adopter, finally, is not simply “the last link” to be won over with the same argument used on everyone else, but rather a segment with a distinct production logic (smaller farms, less formal financial planning) for which technology may not yet be the strategic priority. Before investing in persuasion, it is worth asking whether the first intervention needed is technological, access to financing or stronger farm management strategies.
A second implication of assuming heterogeneity among farmers is that we need to consider better options for measuring the success of an adoption strategy, different from aggregate rates. Eventually, a program that moves low adopters from “partial” to “complete” within a single vertical may have a greater aggregate impact on productivity and environmental sustainability than a program that adds a percentage point to the high-adopter segment.
A third conclusion is that communication channels are not merely a logistical consideration, but a strategic choice. Personal relationships and face-to-face interactions will likely remain fundamental in agriculture. At the same time, new communication channels are becoming increasingly important. For example, WhatsApp, with its ease of use and all-in-one functionality, is particularly valued by the most innovation-oriented farmers, who have readily incorporated it into their decision-making and interactions with suppliers. The key challenge is not simply to use more channels, but to identify the right channel to initiate the conversation.
Finally, if we think about differentiated strategies, the largest segment, the low-adopter segment, has a lot of growth potential and should not be overlooked. If that 45% begins shifting toward complete adoption within some vertical (likely digital, which already has the highest penetration), it would be the earliest sign that the market could scale, and the companies that have already solved that segment’s specific friction points will capture most of that growth.
References
Fiocco, D., Ganesan, V., Garcia de la Serrana Lozano, M., & Sharifi, H. (2023). Agtech: Breaking down the farmer adoption dilemma. McKingsey & Company.
Khanna, M., Atallah, S. S., Heckelei, T., Wu, L., & Storm, H. (2024). Economics of the Adoption of Artificial Intelligence–Based Digital Technologies in Agriculture. Annual Review of Resource Economics, 16(Volume 16, 2024), 41–61. https://doi.org/10.1146/annurev-resource-101623-092515
Malone, T., Fiechter, C., Meng, Z., Lowenberg-DeBoer, J., Erickson, B., & Akridge, J. (2026). Is Precision Agriculture Technology Adoption Persistently Overestimated? Agribusiness. https://doi.org/10.1002/agr.70085
McFadden, J., Njuki, E., & Griffin, T. (2023). Precision Agriculture in the Digital Era: Recent Adoption on U.S. Farms (248; Economic Information Bulletin). Economic Research Service USDA.
About the Center for Food and Agricultural Business
Founded in 1986, the Purdue University Center for Food and Agricultural Business is celebrating 40 years of working with the agribusiness industry to develop leaders and inform better decision-making. Housed within Purdue’s Department of Agricultural Economics, the center connects faculty expertise with the practical challenges facing food and agricultural companies.
The center delivers professional development programs, industry research and graduate education designed specifically for agribusiness professionals. Offerings include open-enrollment workshops, custom corporate training and the MS-MBA in Food and Agribusiness Management, a dual-degree program developed with industry for working professionals.
Through its research and publications – including the Purdue Agribusiness Review – the center shares industry insights from Purdue faculty and collaborators to help agribusiness leaders navigate change and make more informed strategic decisions.