Consumer Corner is BACK in 2025! We’ve updated our platform with new features, making it easier to search content, find you favorite past posts and revisit missed conversations. All content since 2020 remains available, and we’re building on those discussions with fresh insights.
Over the past five years, we’ve explored decision-making, market dynamics (both intentional and unexpected) and the role of data and analytics in driving business choices. In 2025, we’re back to a monthly posting schedule and the same core mission: to challenge how consumer research, human behavior and economics inform decision-making. Lessons can be learned from non-traditional places, such as customer service, social media algorithms, even casinos. What insights can we apply to agribusiness? Let’s keep exploring.
Acknowledgements: Thank you to Dr. Nicole Olynk Widmar, Dr. Valerie Kilders, Dr. Chad Fiechter, Austin B. Berenda, Anam Ali, Alyx Fisk, Dr. Zack Neuhofer, and Owen Zakrzewski for their help in data collection and/or conceptualization.
February might be the shortest month of the year, but it contains two notable dates which are culturally linked to indulgence (and potentially overindulgence) of alcoholic beverages: Superbowl Sunday and Valentine’s Day. These events are celebrated with festivities that often including (responsible) drinking. Furthermore, references of holidays and related celebrations are common in online and social media data.
The alcohol industry in the U.S. holds significant social and economic influence, with a long-standing presence in advertising, holiday celebrations, and many Americans report drinking alcohol on a weekly basis (Gallup, 2024). Surveys of alcohol use in the U.S. since the 1970s have consistently found that roughly 60% of adults consume alcoholic beverages. However, breaking this down by age shows us that the rate of 18- to 34-year-olds drinking has fallen around 10% since the early 2000s (from 72% to 62%), while drinking among adults 55 and older has increased from 49% to 59% (Gallup, 2023).
Some of the declines in drinking alcoholic beverages have been offset by an increase in consumption of specifically non-alcoholic drink offerings, such as non-alcoholic beer and mocktails (McLymore, 2025). These mocktails and related non-alcoholic drinks may have strong flavor profiles which consumers have shown increasing interest in (Rawat, 2023). The medical community is strengthening its long-held view that alcohol use negatively affects the human body, recently declaring that no level of alcohol consumption is safe for human health (WHO, 2023). Conclusions of the effect of alcohol on human health are backed by decades of evidence-based research (MacMahon, 1987; Bujanda, 2000; Eckardt, et al., 2006; Rehm, 2011; Becker, 2012; WHO, 2023).
Online and social media data collected
Purdue University researchers wondered if we could see these trends emerge in online media data generated by news and social media posts. Social media data has been useful for us to study public perceptions of Daylight Savings Time, #halloween and #Galentines day, so why not alcoholic beverages? We analyzed social media mentions of five beverage categories – beer, wine, spirits, seltzers and non-alcoholic drinks – from March 1, 2023 to June 1, 2024. Additionally, we measured net sentiment, which is a useful metric derived by analyzing some of these mentions in a Natural Language Processor, assigning the mentions a positive, negative, or neutral sentiment based on context and tone. We take a weekly ratio of positive to negative mentions and report a net sentiment score. Looking at numbers of mentions and the associated sentiment of search results over time can show how preferences might change according to the time of year. After all, seasons change and so do consumption patterns; might media discussions about beverages follow suit?
Search results
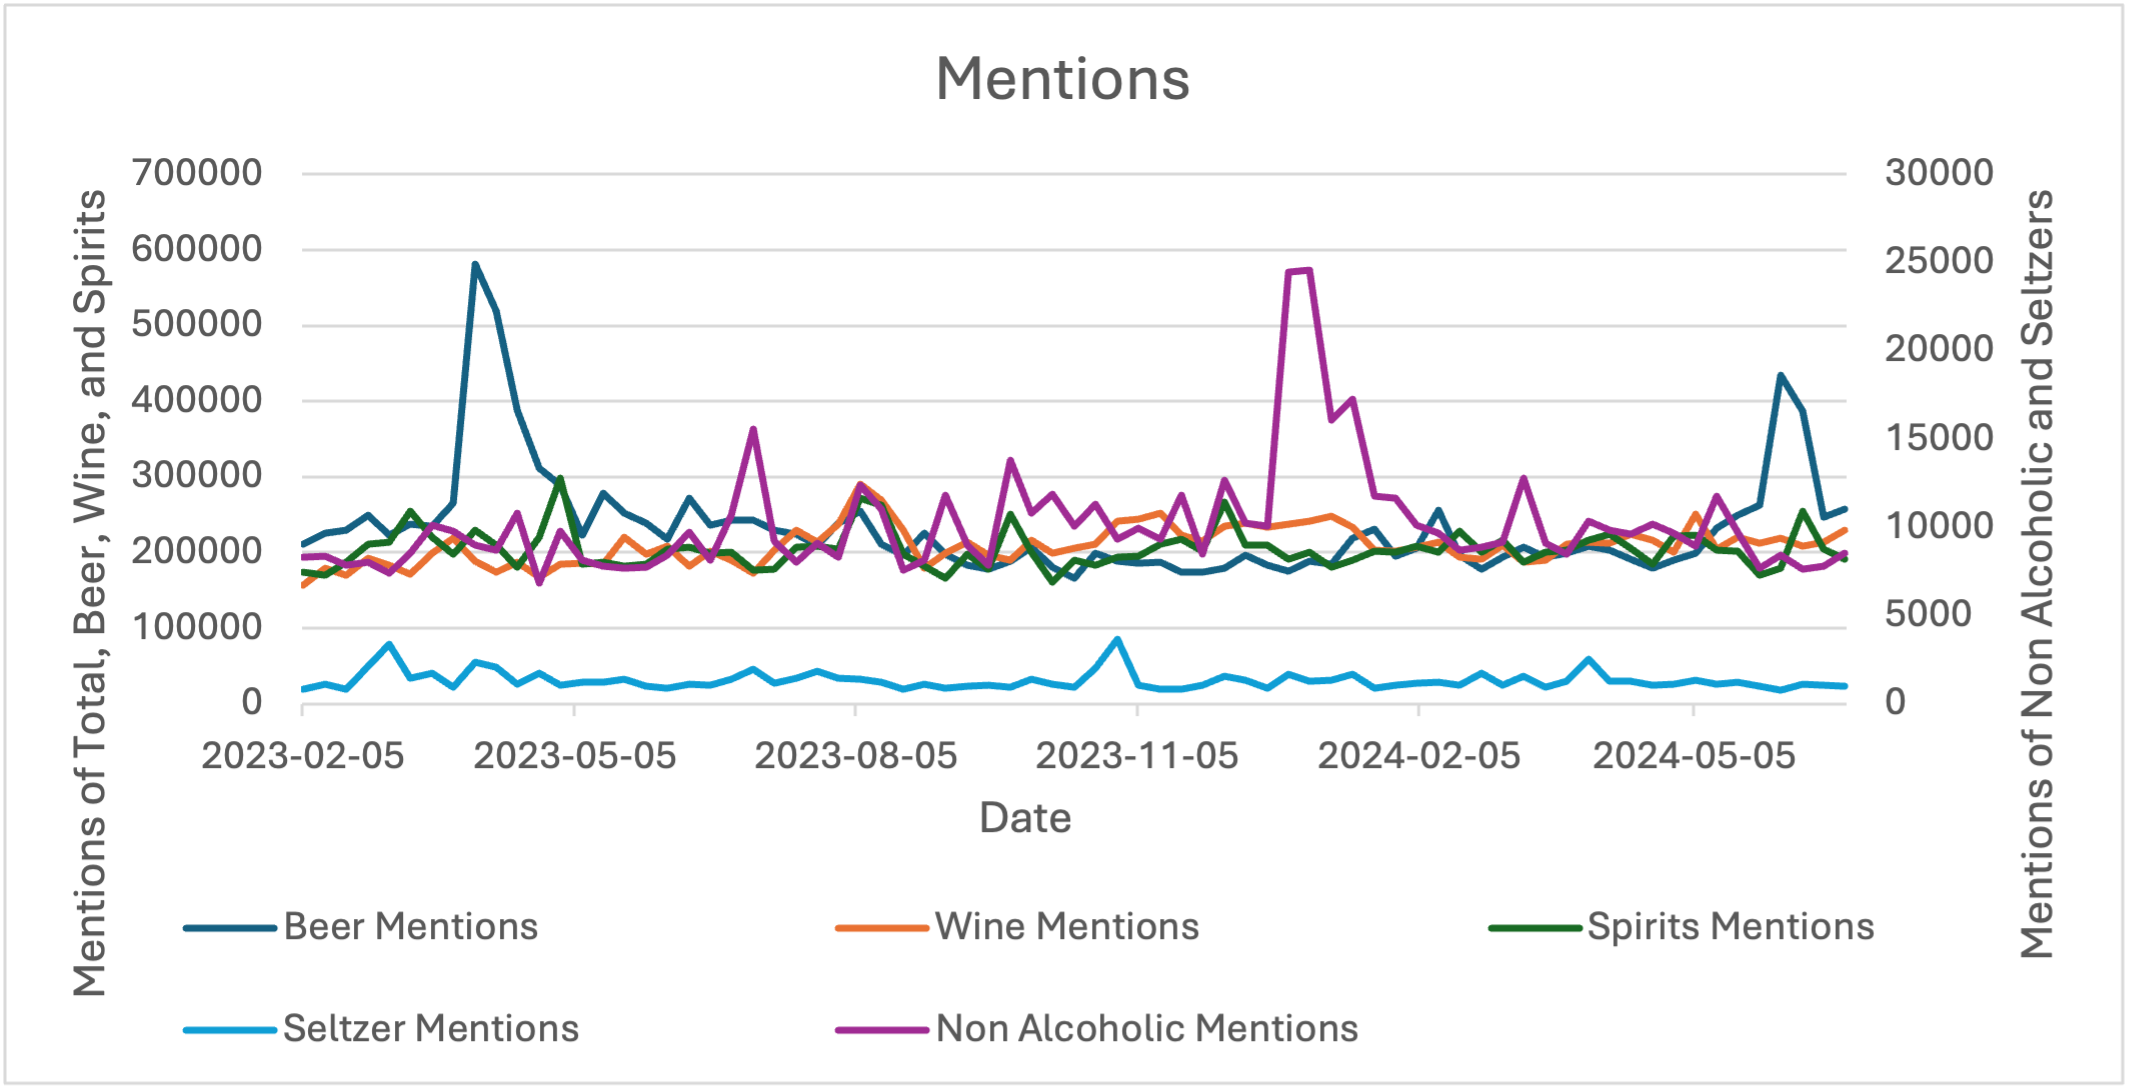
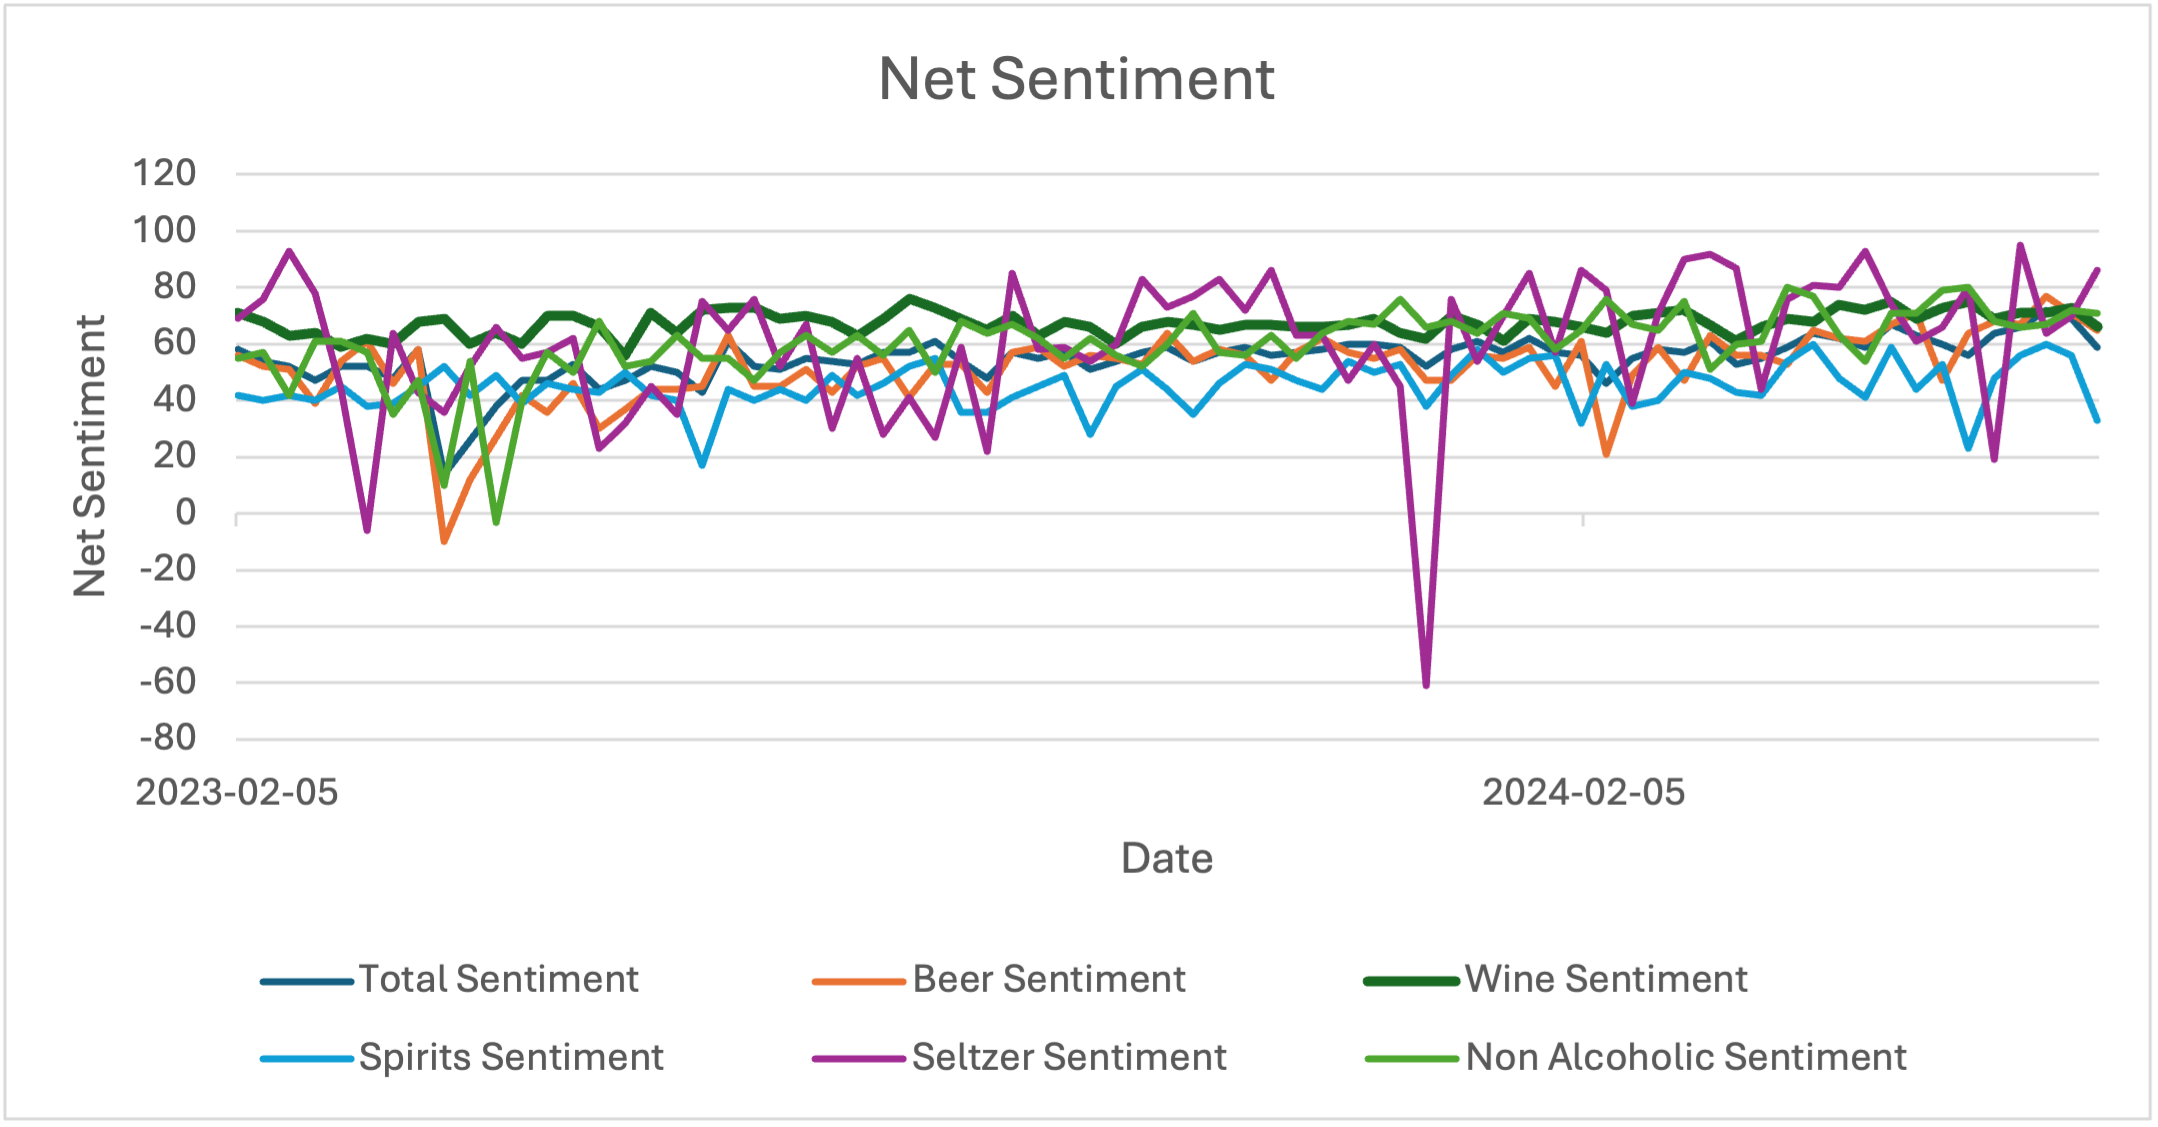
Trends in the data show mentions of beer, spirits and seltzers fall throughout the collection period, but we see a rise in the number of weekly mentions of wine and non-alcoholic drinks. While weekly net sentiment is mostly positive (indicating more positive mentions than negative mentions about the beverage categories), we see one large blip of negative sentiment in seltzers the week of 12/24/24 – the week of Christmas and Boxing Day. Notice that harsh dip in sentiment corresponds to a large rise in mentions of seltzers. Anecdotally, we tend to notice that spikes in mentions are often accompanied by spikes in negative sentiment. From prior experience, we suspect that this could be influenced by having a relatively small sample (when compared to the larger categories).

Mentions of non-alcoholic and seltzers are relatively low; thus, we placed them on a secondary (right-most) y-axis just so we could tease out the variance – or else we would not be able to notice anything useful!

This all begs the question: what drives the trends?
A plausible hypothesis would be that online discussion of alcoholic beverages might have seasonal relationships, or perhaps these discussions are driven by holidays. To get to the bottom of this, we computed a simple linear regression of each data series as the dependent variable to be predicted by a dummy variable for federal holidays in the U.S. The nature of a dummy variable is such that it takes a binary value (either 0 or 1). In this case, the holiday variable =1 on the week of a federal holiday, and 0 otherwise.
We find that the presence of a federal holiday does not explain the volume of mentions or the net sentiment of these beverages in most cases, except for liquor mentions (at the 10% significance level) and non-alcoholic drink mentions (at the 1% significance level). According to the r2 statistic, the federal holidays account for 5.5% of the variation in Liquor mentions and 17.5% of the variation in non-alcoholic beverage mentions. This suggests a relationship between federal holidays and discussions of liquor and non-alcoholic beverages.
Interestingly, when examining the model coefficients, we find that in both cases of liquor and non-alcoholic beverages, the presence of a federal holiday had a negative effect on conversation levels. This is not what we expected. While we expected to find a statistically significant relationship in some categories, we did not expect holidays to have a negative effect on mentions. In fact, we would have hypothesized the opposite. There is no case in which the presence of a federal holiday explains the net sentiment of a beverage category.
While there is a profitable and very real intersection between the agriculture and adult beverage industries, that is not the point of this Consumer Corner entry. Our point is that industries outside of beverages can learn valuable lessons from how this sector adapts. The beverage industry has found a way to meet the needs of consumers who are more conscious of their health, selective about the flavors they consume, and increasingly motivated to look for local suppliers with strong environmental attributes – trends that extend beyond alcohol. These are big themes we see along agricultural value chains as well. Just as non-alcoholic beverages and seltzers have given producers new ways to cater to diverse consumer preferences, other industries will need to capitalize on their own market disrupters. Without a doubt, the beverage industry needs big-data solutions to understand its changing, multi-faceted consumers. And without a doubt, your industry can benefit too.
ConsumerCorner.2025.Letter.03
References
Becker, H. (2012). Effects of Alcohol Dependence and Withdrawal on Stress Responsiveness and Alcohol Consumption. Alcohol Research, 448-458.
Blackwell, A., De-Goyle, K., Hollands, G., Morris, R., Brocklebank, L., Maynard, . . . Munafo, M. (2020, May 06). The impact on selection of non-alcoholic vs alcoholic drink availability: an online experiment. BMC Public Health. Retrieved from bmcpublichealth.biomedcentral.com: https://bmcpublichealth.biomedcentral.com/articles/10.1186/s12889-020-08633-5
Bujanda, L. (2000). The effects of alcohol consumption upon the gastrointestinal tract. The American Journal of Gastroenterology, 3374-3382.
Clarke, N., Blackwell, a., Ferrar, J., De-Loyle, K., Pilling, M., Munafo, M., . . . Hollands, G. (2023). Impact on alcohol selection and online purchasing of changing the proportion of available non-alcoholic versus alcoholic drinks: A randomised controlled trial. pubmed.ncbi.nlm.nih.gov.
Eckardt, M. J., File, S. E., Gessa, G. L., Grant, K. A., Guerri, C., Hoffman, P. L., . . . Tabakoff, B. (2006). Effects of Moderate Alcohol Consumption on the Central Nervous System*. Alcoholism: Clinical and Experimental Research, 998-1040.
Gallup. (2023, August 22). Young Adults in U.S. Drinking Less Than in Prior Decades . Retrieved from https://news.gallup.com/poll/509690/young-adults-drinking-less-prior-decades.aspx#:~:text=Young%20Adults%20Now%20Vie%20With,from%2049%25%20to%2059%25.
Gallup. (2024). Alcohol and Drinking. Retrieved from news.gallup.com: https://news.gallup.com/poll/1582/alcohol-drinking.aspx
MacMahon, S. (1987). Alcohol Consumption and Hypertension. Hypertension: American Health Association.
McLymore, A. (2025, January 4th). Even before US alcohol warning, younger Americans were turning to mocktails. Retrieved from Reuters: https://www.reuters.com/world/us/even-before-us-alcohol-warning-younger-americans-were-turning-mocktails-2025-01-04/
Rehm, J. (2011). The Risks Associated With Alcohol Use and Alcoholism. Alcohol Res Health, 135-143.
WHO. (2023, January 4). No level of alcohol consumption is safe for our health . Retrieved from https://www.who.int/europe/news/item/04-01-2023-no-level-of-alcohol-consumption-is-safe-for-our-health


