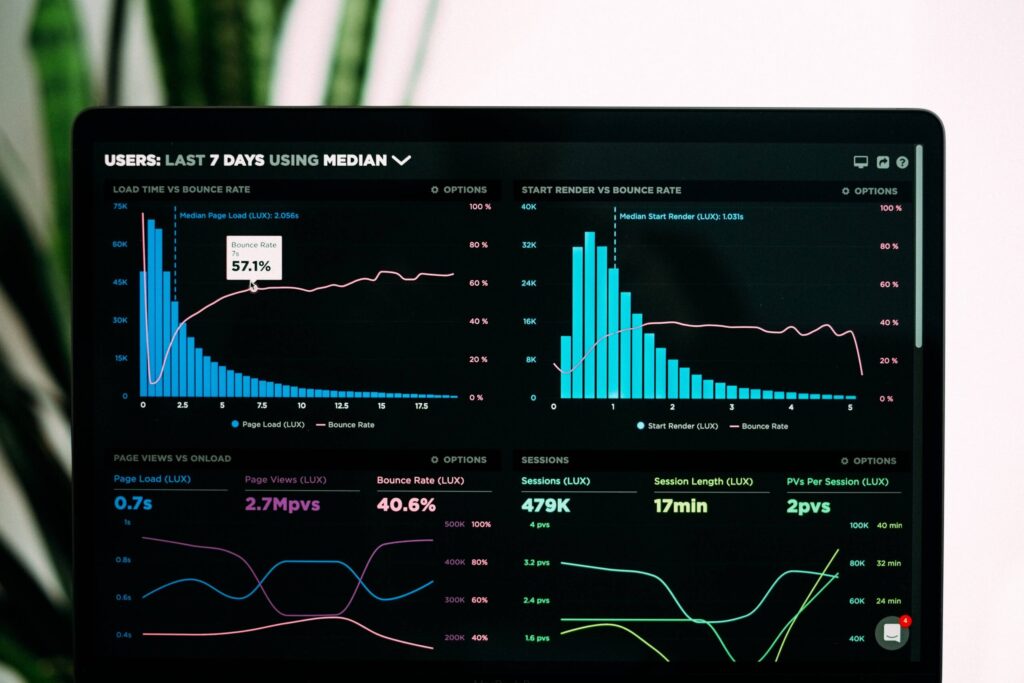
Everything is about data these days — data-driven decision making, impassioned arguments about whether public policy decisions are ‘based on data’ or ‘supported by the data’, etc. But what data are we talking about? Everyone is tossing around “the data” as if there is some universally agreed upon dataset. Soon we’ll be calling it The Data, using “the” with the same enthusiasm as when referencing The Ohio State University.
Here on Consumer Corner, we pride ourselves in being rooted in data-driven insights that can inform sound and timely decision making. And as an integral aspect of that data-driven part, we try to be very clear about what data we’re referring to, where it came from, who it was analyzed by and if it was peer or otherwise reviewed. It isn’t enough to say “the data”, and we try to lead by example in being transparent about exactly what data we’re using and when.
We’ve heard from Dr. Jayson Lusk about data dashboards assisting in the assessment of supply shocks (like COVID-19) by way of the Purdue Food and Agriculture Vulnerability Index. We’ve looked at the era of rating one’s grocery items in the online marketplace, collected and analyzed data about home gardening from Dr. Courtney Bir and concerns about gluten from Dr. Bailey Norwood. And we’ve reported on our own peer-reviewed journal articles published using online media data collection and analytics on topics from #Eggs to #USDA to #DisneyWorld, just to name a few. Closer to home, we dug into the online and public perceptions of Bayer, Dupont, Land O’ Lakes, Monsanto and Syngenta. We’ve even gone so far as to discuss the (admittedly superior) data-driven decision making capacity of squirrels.
The core of what happens here rests on data-driven insights, except those few times we ventured into pandemic fashion, or the time I called you a hypocrite right to your face and then reminded you to mind your manners and watch your words. But now, nearly a year since you were Welcomed to Consumer Corner on June 1st 2020, I think it’s time to ask a simple question with a very complicated answer. Much ado about data, but what is data anyway?
According to dictionary.com, data is: individual facts, statistics or items of information; information in digital format, as encoded text or numbers, or multimedia images, audio, or video; a body of facts; information. Data stored or encoded as text or numbers is likely the most familiar form of data as referenced in a dataset that we might use for quantitative analyses. Qualitative data, often appearing in narrative form — or simply words stored in a variety of formats — results from efforts such as focus groups and interviews and can be analyzed in a variety of ways to derive insights.
Increasingly, we are awash in data, but seldom do we stop to reflect on what data actually is. Interestingly, you generate a ton of it yourself. Smart devices in your house — including your TV, your fridge and other appliances/devices generate enormous amounts of data themselves. When you include your iPads, iPhones, computers and those of your family members, your humble household existence is actually a data generating marvel.
You don’t just generate data on what you watch, who you call and when you do it, what you type, what you buy, utility usage (including when), etc. You also generate photos, which have data including where and at what time those images were captured. Images are data in the image itself, in addition to the data about the image. Videos of your kids (or your cats) are data; that data is usable by a skilled researcher in studying human interactions, but the video itself is also interesting in terms of where it was recorded, by whom, at what time, how you saved it and whether or not you shared it. Numbers, images, videos, text as data … the list goes on, and the forms and scope of what is data is much more varied and diverse than we tend to acknowledge.
ConsumerCorner.2021.Letter.15


